June 2025 Earth Science Regents — Answer Key & Worked Solutions
Every question from the June 2025 Earth Science Regents exam, with the correct answer and a full step-by-step solution. Check your work, learn the method, then convert your raw score.
These are real questions from the June 2025 Earth Science New York State Regents examination, published by NYSED. Worked solutions are written by RegentsLab.
The heliocentric model of the solar system shows the
- (A) temperature of the Sun compared to the temperature of the planets
- (B) age of the Sun compared to the age of the planets
- (C) location of the planets in relation to the Sun ✓
- (D) size of the planets in relation to the Sun
Worked solution
The heliocentric model's defining feature is the arrangement of planets orbiting the Sun, showing their relative positions/distances from it.
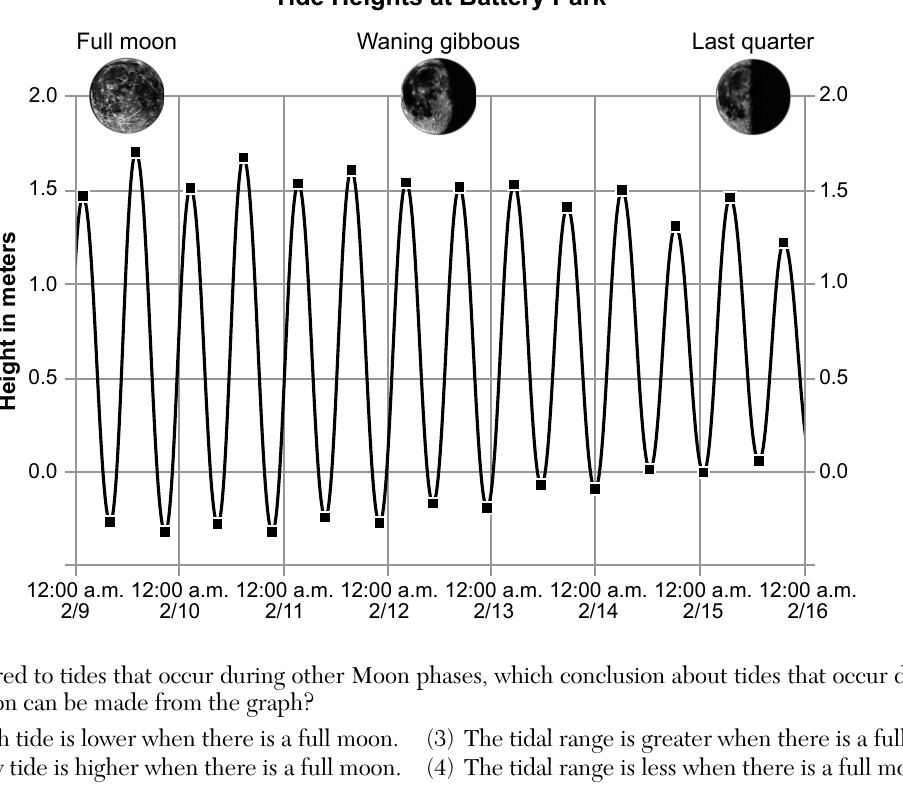
The graph below shows the ocean tides at Battery Park in New York City from February 9 to February 15, 2020. The phases of the Moon for select dates are shown at the top of the graph (Full moon, Waning gibbous, Last quarter). Compared to tides that occur during other Moon phases, which conclusion about tides that occur during a full moon can be made from the graph?
- (A) High tide is lower when there is a full moon.
- (B) Low tide is higher when there is a full moon.
- (C) The tidal range is greater when there is a full moon. ✓
- (D) The tidal range is less when there is a full moon.
Worked solution
Near the full moon the Sun and Moon align with Earth, producing spring tides with the largest difference between high and low tide (greatest tidal range), which is visible as the tallest peak-to-trough swing on the graph.
Evidence of Earth's rotation on its axis is provided by both the
- (A) Doppler effect and El Niño
- (B) Doppler effect and the Coriolis effect
- (C) Foucault pendulum and El Niño
- (D) Foucault pendulum and the Coriolis effect ✓
Worked solution
Both the Foucault pendulum's apparent change in swing direction and the Coriolis deflection of moving fluids are direct consequences of, and thus evidence for, Earth's rotation on its axis.
At which New York State location is the observed altitude of Polaris approximately 42°?
- (A) Rochester
- (B) New York City
- (C) Plattsburgh
- (D) Binghamton ✓
Worked solution
The altitude of Polaris above the horizon equals the observer's latitude; Binghamton, NY lies at approximately 42° N latitude, matching the given altitude.
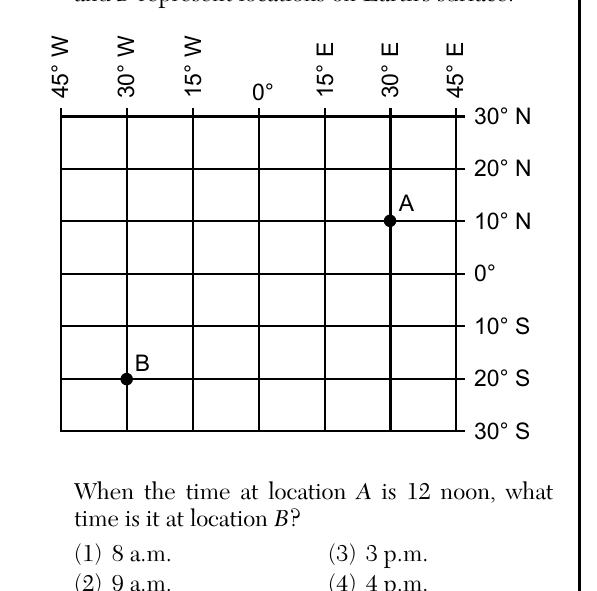
The diagram below represents a portion of Earth's latitude and longitude system. Letters A and B represent locations on Earth's surface. Point A is located at approximately 30° E longitude, 10° N latitude. Point B is located at approximately 30° W longitude, 20° S latitude. When the time at location A is 12 noon, what time is it at location B?
- (A) 8 a.m. ✓
- (B) 9 a.m.
- (C) 3 p.m.
- (D) 4 p.m.
Worked solution
B is 60° of longitude west of A, and since Earth rotates 15° per hour, local time at B is 4 hours earlier than at A, making it 8 a.m. at B when it is 12 noon at A.
Orion is a constellation of stars that is visible in the evening sky in New York State from November through February. Orion is not visible the rest of the year because
- (A) Earth rotates on its axis
- (B) Earth revolves around the Sun ✓
- (C) Orion rotates on its axis
- (D) Orion revolves around Earth
Worked solution
Earth's revolution around the Sun changes which portion of the sky is visible at night throughout the year, explaining why Orion is seasonal rather than visible year-round.
The hydrosphere is a relatively thin layer of
- (A) solid rock making up approximately 70% of Earth's surface
- (B) solid rock making up approximately 30% of Earth's surface
- (C) water covering approximately 70% of Earth's surface ✓
- (D) water covering approximately 30% of Earth's surface
Worked solution
The hydrosphere consists of all water on Earth's surface, which covers approximately 70% of the planet's surface area.
Earth revolves around the Sun at a rate of approximately
- (A) 1° per day ✓
- (B) 360° per day
- (C) 15° per hour
- (D) 23.5° per hour
Worked solution
Earth's one full orbit (360°) around the Sun takes about 365 days, so it moves roughly 1° along its orbit per day.
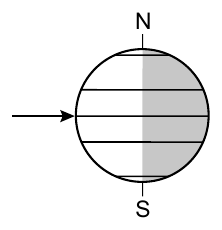
The diagram below represents Earth's position relative to the Sun's rays on September 23. The arrow shows the Sun's direct rays striking the equator at solar noon. During the next six months, the angle of the Sun's rays striking the equator at solar noon will
- (A) decrease only
- (B) decrease then increase ✓
- (C) increase only
- (D) increase then decrease
Worked solution
From the September equinox, the Sun's direct rays migrate south toward the December solstice (angle at the equator decreases), then migrate back toward the equator by the March equinox (angle increases again), so over the six months the angle decreases then increases.
Which type of unsaturated sediment will have the greatest permeability during a rainstorm?
- (A) rounded and tightly packed
- (B) rounded and loosely packed ✓
- (C) flattened and tightly packed
- (D) flattened and loosely packed
Worked solution
Rounded, loosely packed sediment has the largest connected pore spaces, allowing water to infiltrate most easily, giving it the greatest permeability.
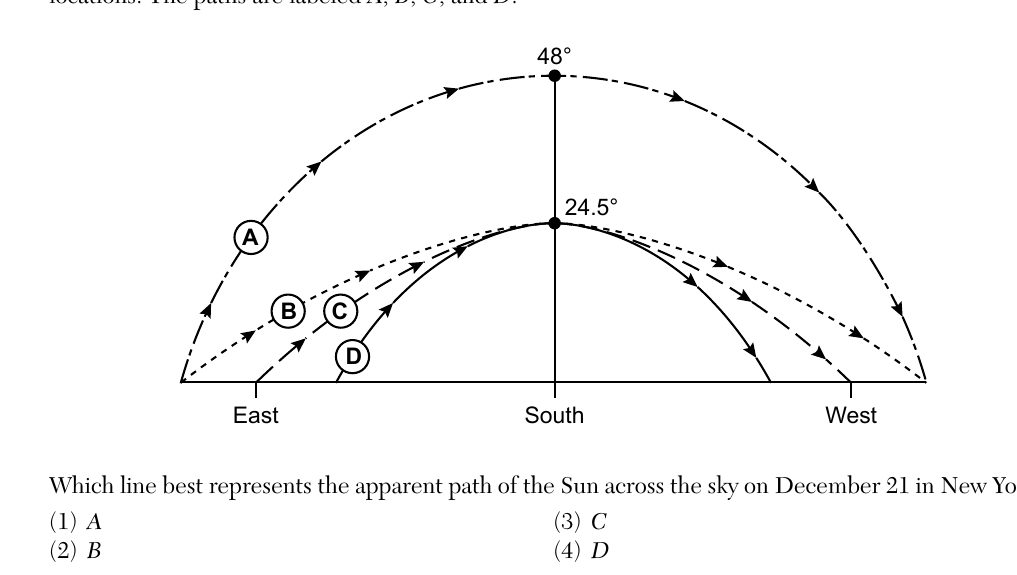
The diagram below represents four different apparent paths of the Sun across the sky at four different locations. The paths are labeled A, B, C, and D, with angles of 48° and 24.5° marked at their peaks. Which line best represents the apparent path of the Sun across the sky on December 21 in New York State?
- (A) A
- (B) B
- (C) C
- (D) D ✓
Worked solution
On December 21 (winter solstice) in New York State the Sun follows its lowest, shortest daily arc across the sky, which corresponds to path D in the diagram.
Which table correctly indicates the locations of the polar front jet stream and subtropical jet stream near the time of the equinox? Table 1: Polar Front Jet Stream: 60° North and 60° South; Subtropical Jet Stream: 30° North and 30° South. Table 2: Polar Front Jet Stream: 30° North and 30° South; Subtropical Jet Stream: 60° North and 60° South. Table 3: Polar Front Jet Stream: 90° North and 90° South; Subtropical Jet Stream: 30° North and 30° South. Table 4: Polar Front Jet Stream: 90° North and 90° South; Subtropical Jet Stream: 60° North and 60° South.
- (A) Polar Front Jet Stream: 60° North and 60° South; Subtropical Jet Stream: 30° North and 30° South ✓
- (B) Polar Front Jet Stream: 30° North and 30° South; Subtropical Jet Stream: 60° North and 60° South
- (C) Polar Front Jet Stream: 90° North and 90° South; Subtropical Jet Stream: 30° North and 30° South
- (D) Polar Front Jet Stream: 90° North and 90° South; Subtropical Jet Stream: 60° North and 60° South
Worked solution
Near the equinox, the polar front jet stream is located near 60° N/S latitude and the subtropical jet stream near 30° N/S latitude, matching table 1.
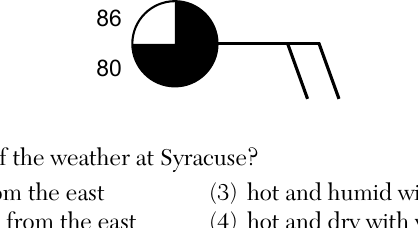
The station model below represents some weather conditions at Syracuse, New York, showing a temperature of 86°F, a dewpoint of 80°F, a mostly-shaded (nearly overcast) sky symbol, and wind barbs extending toward the lower right (from the east) with two full barbs. What is the best description of the weather at Syracuse?
- (A) hot and dry with winds from the east
- (B) hot and humid with winds from the east ✓
- (C) hot and humid with winds from the west
- (D) hot and dry with winds from the west
Worked solution
A small spread between temperature (86°F) and dewpoint (80°F) indicates humid air, and the wind barb's shaft points to the east, showing the wind is coming from the east, so the weather is hot and humid with easterly winds.
Which air mass is characterized by high relative humidity and low air temperature?
- (A) maritime polar ✓
- (B) maritime tropical
- (C) continental polar
- (D) continental tropical
Worked solution
Maritime air masses form over water and are moist (high humidity), while polar air masses form at high latitudes and are cold, so a maritime polar air mass is both cold and humid.
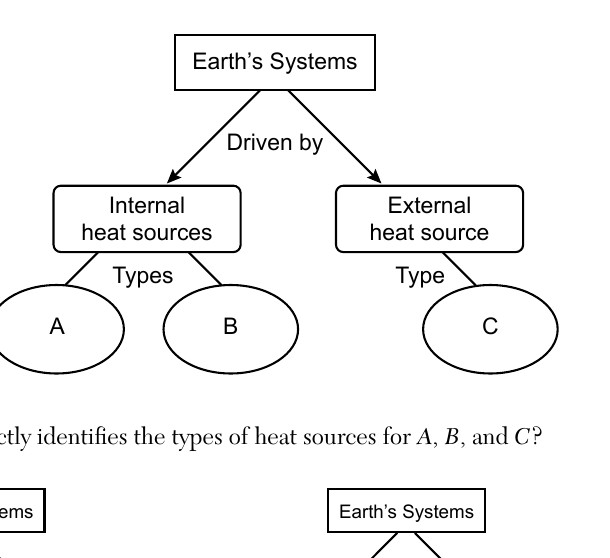
The incomplete flow chart below represents heat sources that provide energy for Earth's systems. The types of heat sources, labeled A, B, and C, have been left blank, branching from 'Internal heat sources' (A and B) and 'External heat source' (C) beneath 'Earth's Systems: Driven by'. Which flow chart correctly identifies the types of heat sources for A, B, and C?
- (A) Internal heat sources: solar energy, volcanic activity; External heat source: radioactive decay
- (B) Internal heat sources: radioactive decay, residual heat from Earth's formation; External heat source: solar energy ✓
- (C) Internal heat sources: solar energy, radioactive decay; External heat source: residual heat from Earth's formation
- (D) Internal heat sources: radioactive decay, solar energy; External heat source: volcanic activity
Worked solution
Earth's internal heat sources are radioactive decay and residual heat left over from Earth's formation, while the external heat source driving Earth's systems is solar energy from the Sun.
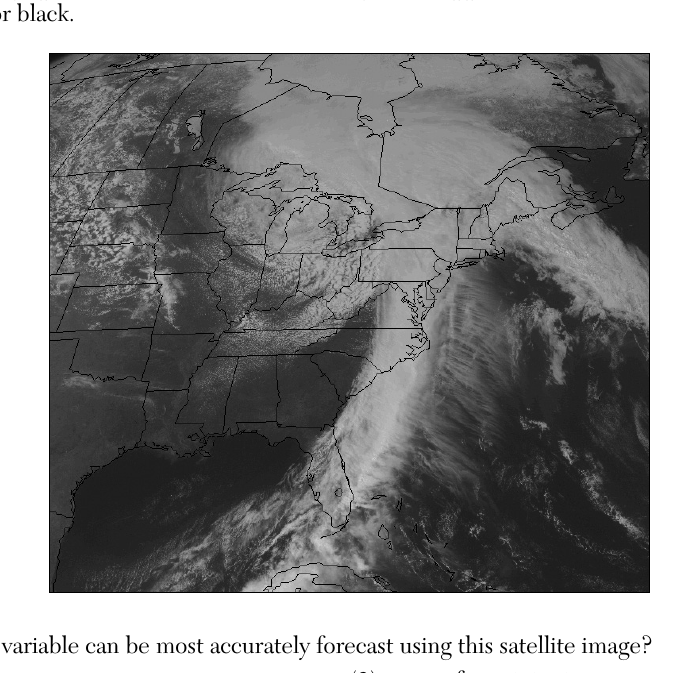
A visible satellite image of the eastern United States is shown below. Visible satellite images resemble black and white photographs because clouds reflect sunlight and appear white, while land and water appear in shades of gray or black. Which weather variable can be most accurately forecast using this satellite image?
- (A) air temperature
- (B) wind speed
- (C) areas of precipitation ✓
- (D) type of precipitation
Worked solution
Because clouds appear white in visible satellite imagery, the image directly shows where cloud cover (and therefore likely precipitation) is located, but it cannot reveal temperature, wind speed, or precipitation type.
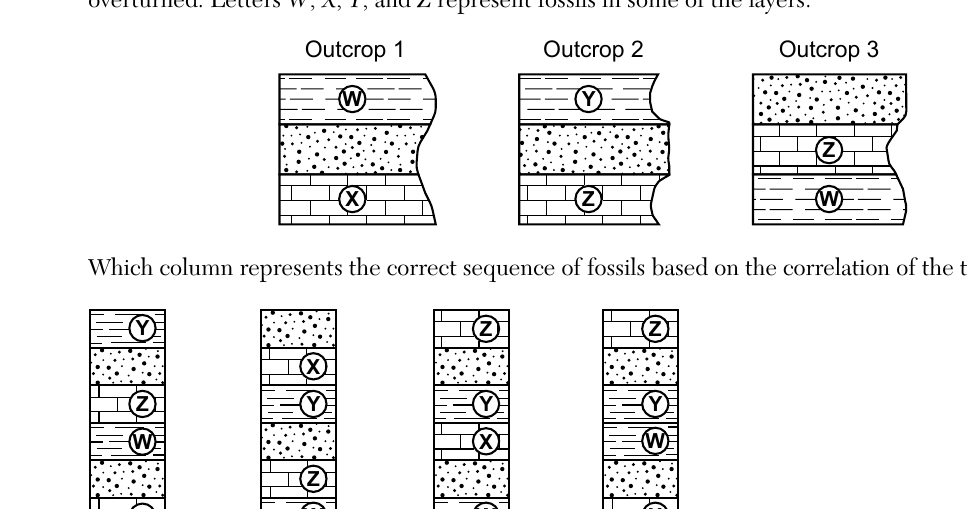
The cross sections below show widely separated outcrops labeled 1, 2, and 3. The rock layers have not been overturned. Letters W, X, Y, and Z represent fossils in some of the layers. Outcrop 1 (bottom to top): X, then a layer with W near the top. Outcrop 2 (bottom to top): Z, then a layer with Y above it. Outcrop 3 (bottom to top): W, then a layer with Z above it. Which column represents the correct sequence of fossils based on the correlation of the three outcrops?
- (A) Column (bottom to top): X, W, Z, Y ✓
- (B) Column (bottom to top): W, Z, X, Z, Y, W
- (C) Column (bottom to top): W, X, Y, Z
- (D) Column (bottom to top): X, W, Y, Z
Worked solution
By using the overlapping fossils (W links outcrops 1 and 3; Z links outcrops 3 and 2) and the principle of superposition, the correlated sequence from oldest (bottom) to youngest (top) is X, W, Z, Y.
Which land surface absorbs the greatest amount of insolation?
- (A) dark color and rough texture ✓
- (B) dark color and smooth texture
- (C) light color and rough texture
- (D) light color and smooth texture
Worked solution
Dark-colored, rough-textured surfaces have the lowest albedo and the greatest surface area for trapping radiation, so they absorb the most insolation.
During which era of Earth's geologic history did oceanic oxygen begin to enter Earth's atmosphere?
- (A) Cenozoic Era
- (B) Paleozoic Era
- (C) Early Archean Era
- (D) Early Proterozoic Era ✓
Worked solution
According to the Geologic History of New York reference table, oceanic oxygen began entering Earth's atmosphere during the Early Proterozoic Era, as photosynthetic life increased atmospheric oxygen levels.
When did humans appear on Earth?
- (A) before abundant grazing mammals and after the earliest flowering plants
- (B) before the earliest grasses and after large carnivorous mammals
- (C) during the same time as mastodonts and mammoths ✓
- (D) during the same time as the first forests and ammonoids
Worked solution
The Geologic History reference table shows that the earliest humans appeared during the same time span as mastodonts and mammoths, in the late Cenozoic Era.
If a rock contained 200 grams of the radioactive isotope potassium-40 ($^{40}K$) when it was formed, but now contains only 25 grams of potassium-40 ($^{40}K$), how many years ago did the rock form?
- (A) $1.3 \times 10^9$ years
- (B) $2.6 \times 10^9$ years
- (C) $3.9 \times 10^9$ years ✓
- (D) $5.2 \times 10^9$ years
Worked solution
Going from 200 g to 25 g of potassium-40 requires 3 half-lives (200→100→50→25); multiplying by potassium-40's half-life of 1.3 × 10^9 years gives 3.9 × 10^9 years since the rock formed.
The Alleghenian and Acadian orogenies were caused by which geologic process?
- (A) deposition of minerals in evaporite basins
- (B) original opening of oceans
- (C) widespread coastal deposition
- (D) collision of landmasses ✓
Worked solution
The Acadian and Alleghenian orogenies were mountain-building events caused by the collision of landmasses (continental plates converging) as ancient continents came together.
The continents of Africa and South America were inferred to be two separate continents
- (A) 59 million years ago ✓
- (B) 119 million years ago
- (C) 232 million years ago
- (D) 359 million years ago
Worked solution
The ESRT landmass reconstruction panels show Pangea breaking apart over time; Africa and South America appear as clearly separated continents only in the youngest (most recent) reconstruction, dated at roughly 59 million years ago.
Which surface feature was produced by crustal movements at a divergent plate boundary?
- (A) San Andreas Fault
- (B) Peru-Chile Trench
- (C) Southeast Indian Ridge ✓
- (D) Tasman Hot Spot
Worked solution
Mid-ocean ridges, like the Southeast Indian Ridge, form where two plates diverge and new oceanic crust is created, making it the correct choice for a divergent boundary feature.
Which Earth layer has a density similar to the density of Mercury?
- (A) oceanic crust
- (B) stiffer mantle ✓
- (C) outer core
- (D) inner core
Worked solution
Comparing Mercury's density (about 5.4 g/cm^3) to the density ranges given for Earth's layers on the Earth's Interior diagram, the stiffer mantle is the closest match.
Which factor is primarily responsible for the development of the stream drainage patterns in New York State?
- (A) bedrock age
- (B) bedrock structure ✓
- (C) types of fossils in the bedrock
- (D) amount of fossils in the bedrock
Worked solution
Stream drainage patterns are shaped by the structural arrangement of the underlying bedrock (folds, faults, joints, rock resistance), not by the age or fossil content of the rock.
Which processes result in the formation of soil?
- (A) the compaction and cementation of sediments
- (B) the melting and solidification of minerals
- (C) biological activity and the weathering of rocks ✓
- (D) the addition of heat and pressure to bedrock
Worked solution
Soil is produced through weathering of rock material along with contributions of organic matter from plants, animals, and microorganisms (biological activity).
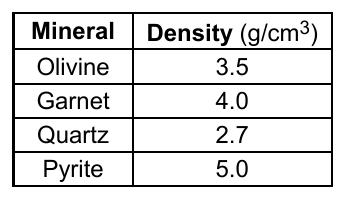
The table below shows the densities of four mineral samples of equal size and shape transported in a stream. As this stream flows into a lake, which mineral sample would most likely be deposited first?
- (A) olivine
- (B) garnet
- (C) quartz
- (D) pyrite ✓
Worked solution
Because all four samples are equal in size and shape, the mineral with the greatest density (pyrite) requires the least amount of stream energy to remain suspended and will settle out first as the stream slows entering the lake.
Hematite and magnetite are mined as ores because they contain the element
- (A) iron ✓
- (B) sulfur
- (C) aluminum
- (D) oxygen
Worked solution
Hematite and magnetite are the two most important iron ore minerals; both are iron oxides mined primarily for their iron content.
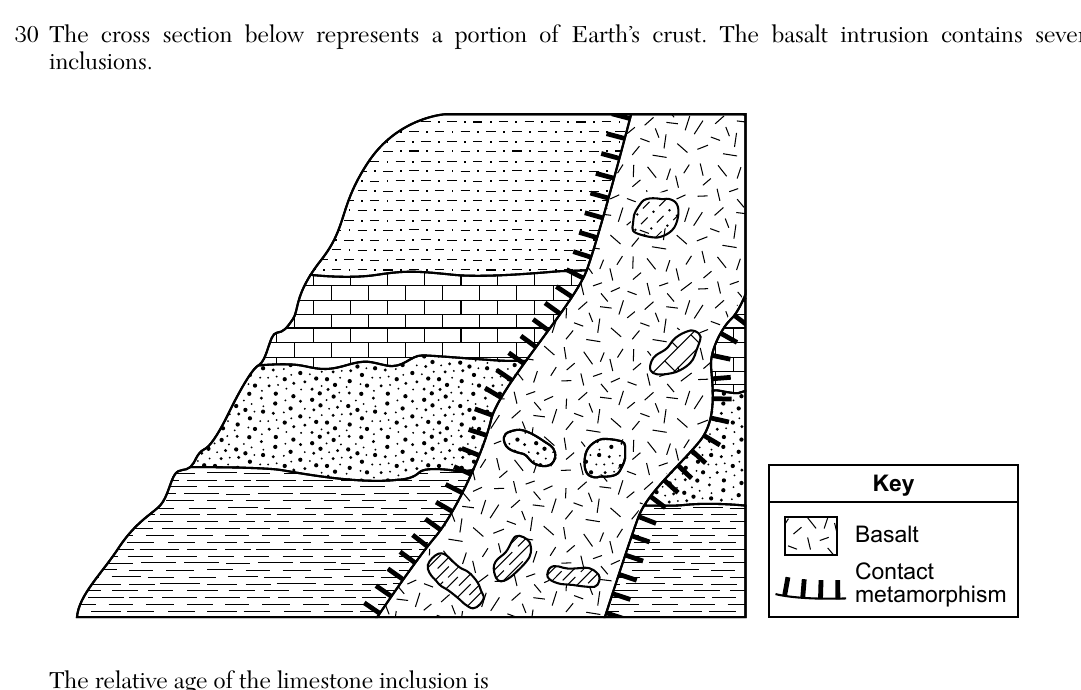
The cross section below represents a portion of Earth's crust. The basalt intrusion contains several inclusions. The relative age of the limestone inclusion is
- (A) younger than the basalt and older than the sandstone layer
- (B) younger than the basalt and older than the limestone layer
- (C) older than the basalt and older than the shale layer
- (D) older than the basalt and older than the siltstone layer ✓
Worked solution
By the law of inclusions, a rock fragment found inside an igneous rock (the basalt) must be older than that igneous rock; the cross section also shows the limestone layer lying beneath (and therefore older than) the siltstone layer.
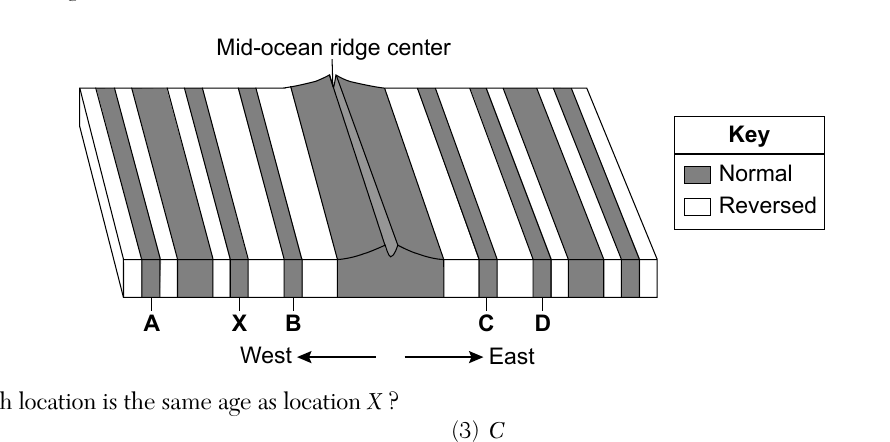
The block diagram below represents the magnetic orientation of igneous bedrock on the seafloor on the western and eastern sides of a mid-ocean ridge. The letters A, B, C, D, and X identify locations of specific bands of magnetic orientation. Which location is the same age as location X?
- (A) A
- (B) B
- (C) C
- (D) D ✓
Worked solution
Because new crust forms symmetrically at a mid-ocean ridge and spreads outward in both directions, a band at a given distance from the ridge on one side is the same age as the band at the same distance on the other side; this pairs X with D.
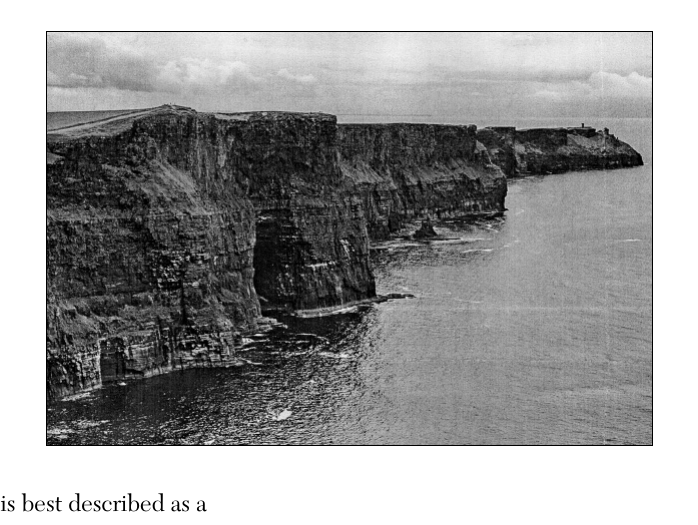
The photograph below shows an escarpment feature formed by uplift and erosion. An escarpment is best described as a
- (A) steep, rocky cliff ✓
- (B) coastal shoreline
- (C) mountain ridge
- (D) depositional basin
Worked solution
An escarpment is defined as a steep, rocky cliff or slope, typically formed by uplift followed by differential erosion.
The photograph below shows parallel scratches on the surface of a rock. Which erosional agent most likely produced these parallel scratches?
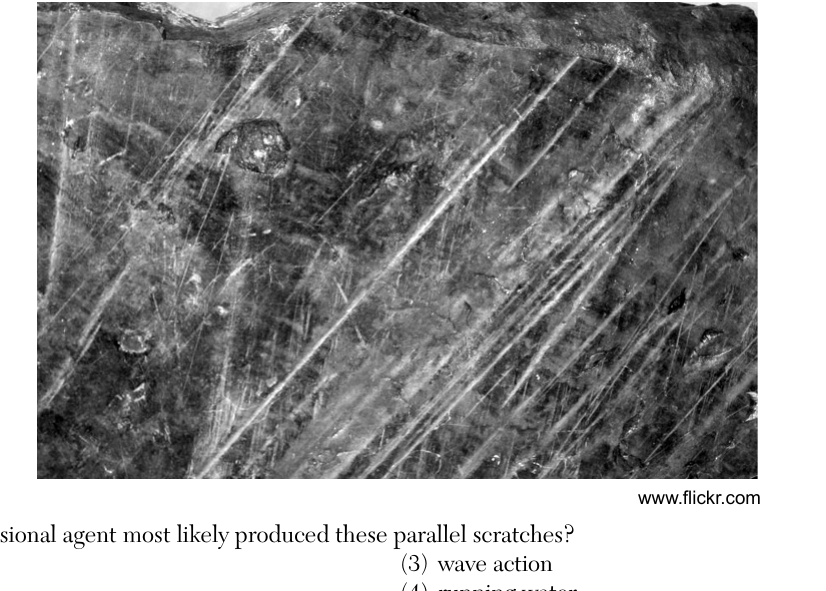
- (A) wind
- (B) glacier ✓
- (C) wave action
- (D) running water
Worked solution
Long, straight, parallel scratches (striations) on bedrock are a classic sign of glacial erosion, produced as rock debris embedded in the base of a moving glacier scrapes across the surface.
The picture below shows a sample of the metamorphic rock hornfels. Hornfels is commonly formed when existing rock is changed due to
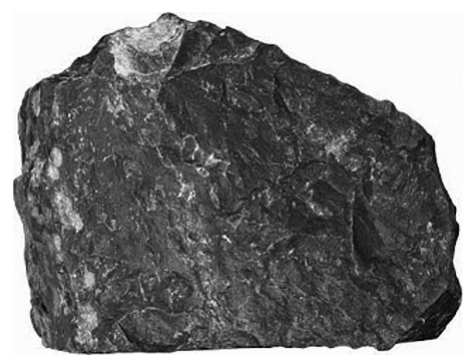
- (A) regional metamorphism of bituminous coal
- (B) contact with rising magma from tectonic activity ✓
- (C) foliation from the pressure of overlying rock layers
- (D) seismic activity along a fault in Earth's crust
Worked solution
Hornfels forms by contact metamorphism, when heat from an intruding magma body alters (bakes) the surrounding rock, producing a hard, non-foliated texture.
The diagram below represents a stream entering a lake. Letters A, B, C, and D represent locations in the stream. At which two locations in the stream will the greatest amount of deposition be occurring?
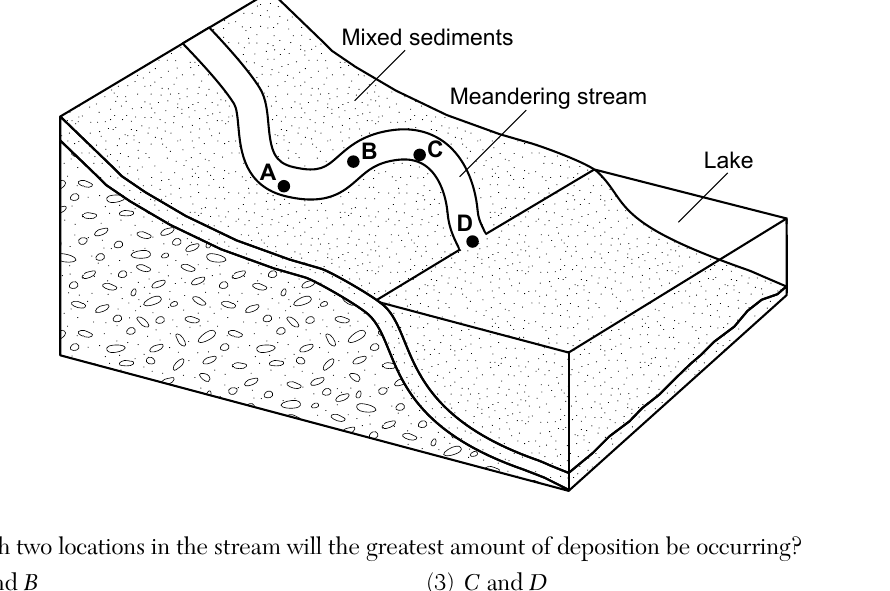
- (A) A and B
- (B) B and C
- (C) C and D ✓
- (D) D and A
Worked solution
As a meandering stream nears its mouth (where it enters the lake), its velocity decreases the most, so the greatest deposition occurs at the locations closest to the lake, C and D.
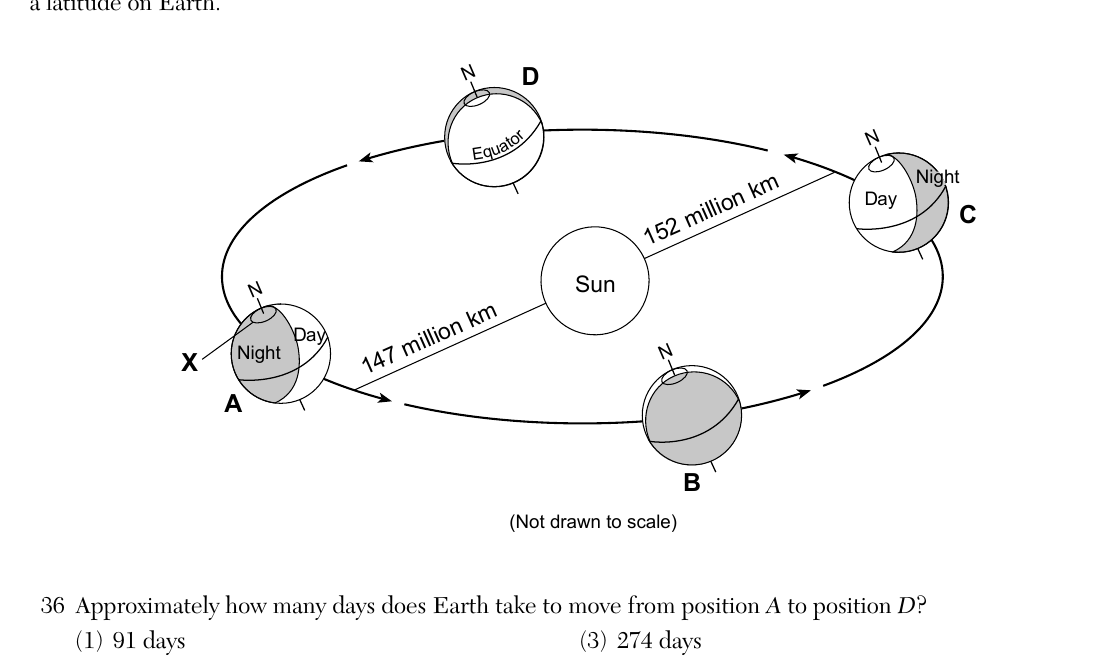
Base your answer on the diagram representing Earth orbiting the Sun with four positions A, B, C, and D labeled, letter N representing the North Pole, distances shown for aphelion (152 million km) and perihelion (147 million km), arrows indicating direction of orbital movement, and letter X representing a latitude on Earth. Approximately how many days does Earth take to move from position A to position D?
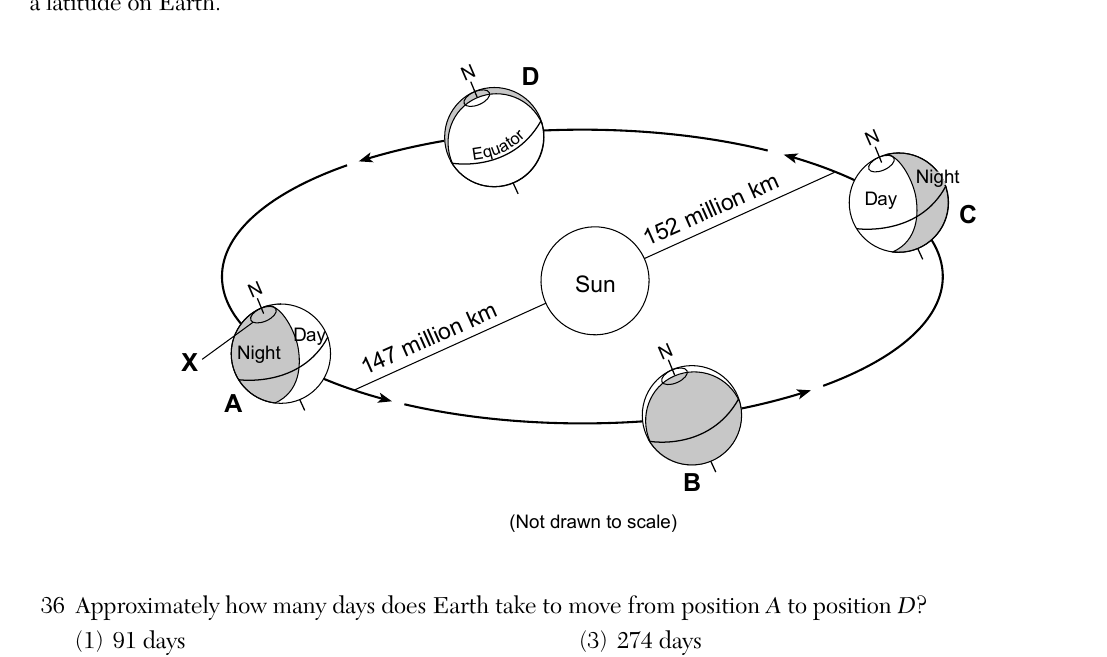
- (A) 91 days
- (B) 183 days
- (C) 274 days ✓
- (D) 365 days
Worked solution
Since the diagram's arrows show Earth's motion carrying it from A around through B and C before arriving at D, this path covers three-quarters of the full orbit, or about 274 days.
Base your answer on the diagram representing Earth orbiting the Sun with four positions A, B, C, and D labeled, letter N representing the North Pole, distances shown for aphelion and perihelion, and letter X representing a latitude on Earth at position A. Which latitude on Earth is represented by location X?
- (A) Tropic of Cancer
- (B) Tropic of Capricorn
- (C) Arctic Circle ✓
- (D) Antarctic Circle
Worked solution
Location X is drawn at the high northern latitude experiencing continuous darkness at the position corresponding to the December solstice, identifying it as the Arctic Circle.
If the tilt of Earth's axis were increased from 23.5° to 31°, the Northern Hemisphere summer would become
- (A) warmer and winter would become warmer
- (B) warmer and winter would become cooler ✓
- (C) cooler and winter would become cooler
- (D) cooler and winter would become warmer
Worked solution
Increasing Earth's axial tilt increases the seasonal extremes: summers become warmer (more direct sunlight, longer days) and winters become cooler (less direct sunlight, shorter days) in the Northern Hemisphere.
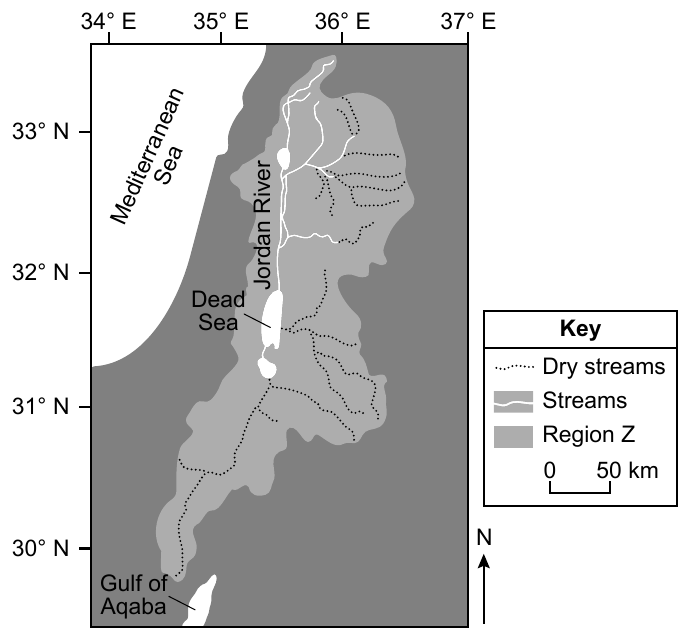
Base your answer on the passage and map about the Dead Sea. The Dead Sea is the lowest point on the surface of Earth. It is a lake at the mouth of the Jordan River, with water 10 times saltier than the ocean. Small amounts of dissolved minerals are transported into the Dead Sea, and over thousands of years these minerals are left behind when the water evaporates. Recent demand for water has decreased the lake's water level from 1296 feet below sea level in 1896 to 1412 feet below sea level in 2016, so the Jordan River's fresh water must flow farther and dissolves layers of minerals previously deposited around the Dead Sea. Which mineral is most commonly found on the shores of the Dead Sea?
- (A) halite ✓
- (B) hematite
- (C) quartz
- (D) talc
Worked solution
As the highly saline water of the Dead Sea evaporates, dissolved sodium chloride precipitates out as halite, making it the most common mineral found along its shores.
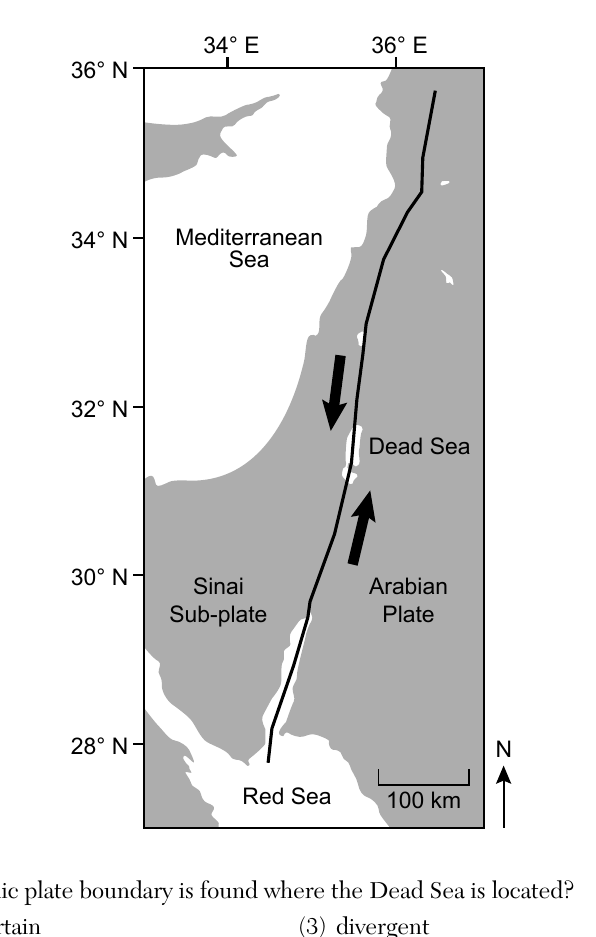
The map below shows the tectonic plate boundary located at the Dead Sea, between the Sinai Sub-plate and the Arabian Plate, extending from the Red Sea north past the Dead Sea. Arrows along the boundary near the Dead Sea point in opposite directions (one plate moving toward the viewer's lower position, the other toward the upper position), parallel to the boundary line. Which type of tectonic plate boundary is found where the Dead Sea is located?
- (A) complex or uncertain
- (B) convergent
- (C) divergent
- (D) transform ✓
Worked solution
The opposing arrows parallel to the plate boundary indicate the two plates are sliding horizontally past each other, which is the defining characteristic of a transform plate boundary (like the Dead Sea Transform fault).
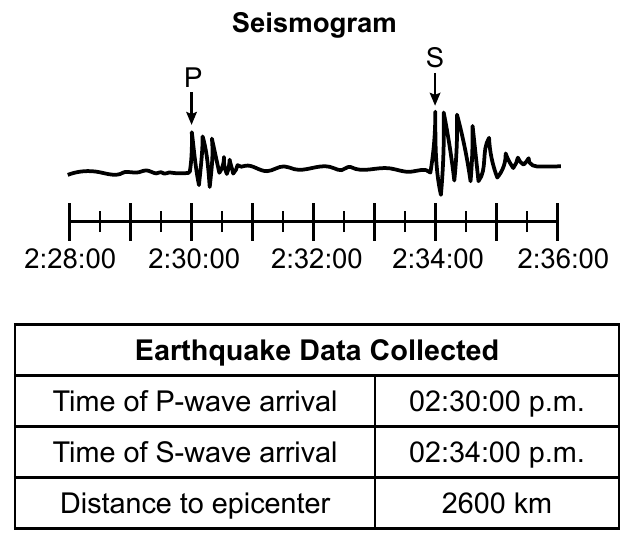
Base your answer on the seismogram and data table for an earthquake recorded at a seismic monitoring station. The seismogram shows a P-wave arrival and an S-wave arrival between time marks 2:28:00 and 2:36:00. The data table states: Time of P-wave arrival = 02:30:00 p.m., Time of S-wave arrival = 02:34:00 p.m., Distance to epicenter = 2600 km. At what time did this earthquake occur?
- (A) 02:21:00 p.m.
- (B) 02:25:00 p.m. ✓
- (C) 02:26:00 p.m.
- (D) 02:35:00 p.m.
Worked solution
Using the Earthquake Travel Time graph, a P-wave travels about 2600 km in roughly 5 minutes, so subtracting that travel time from the P-wave arrival time (02:30:00 p.m.) gives an origin time of about 02:25:00 p.m.
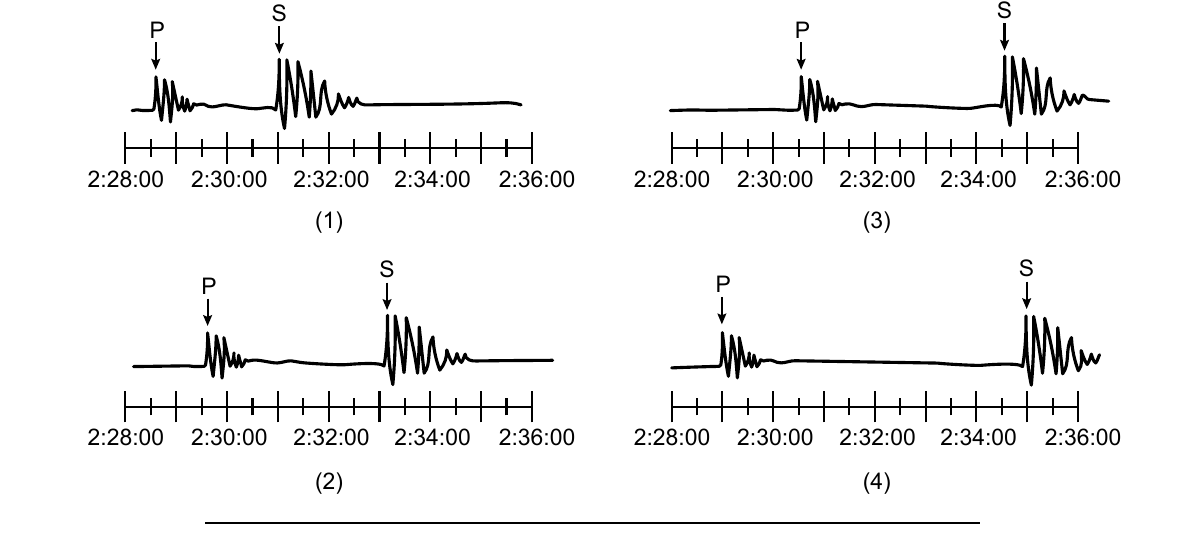
Four seismograms (1 through 4) are shown, each spanning 2:28:00 to 2:36:00 and each showing a P-wave arrival and an S-wave arrival at different times/separations. Which seismogram was recorded closest to the epicenter of this earthquake?
- (A) seismogram (1) ✓
- (B) seismogram (2)
- (C) seismogram (3)
- (D) seismogram (4)
Worked solution
A seismic monitoring station closer to the epicenter records a shorter time gap between the P-wave and S-wave arrivals; seismogram (1) shows the smallest S-P interval of the four, indicating it is closest to the epicenter.
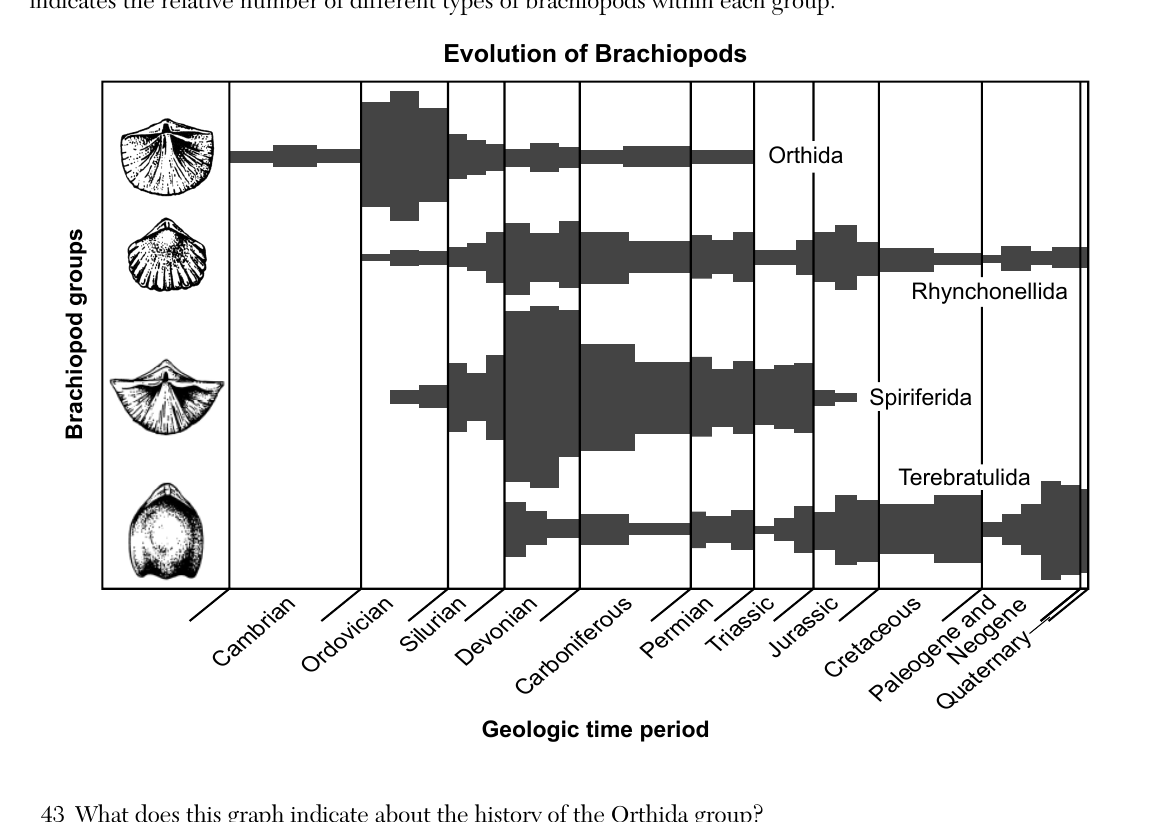
Base your answer on the graph 'Evolution of Brachiopods,' which indicates changes in the number of four different brachiopod groups (Orthida, Rhynchonellida, Spiriferida, Terebratulida) from the early Cambrian to the present, with bar width indicating the relative number of types within each group across geologic time periods (Cambrian, Ordovician, Silurian, Devonian, Carboniferous, Permian, Triassic, Jurassic, Cretaceous, Paleogene and Neogene, Quaternary). What does this graph indicate about the history of the Orthida group?
- (A) They existed for the longest period of geologic time.
- (B) Some types in the Orthida group still exist today.
- (C) More types lived during the Silurian period than the Ordovician period.
- (D) Many types have lived in the past and are now extinct. ✓
Worked solution
The graph shows the Orthida group's bar widening (many types existing) earlier in geologic history but ending well before the present day, showing that although many types once lived, the entire group is now extinct.
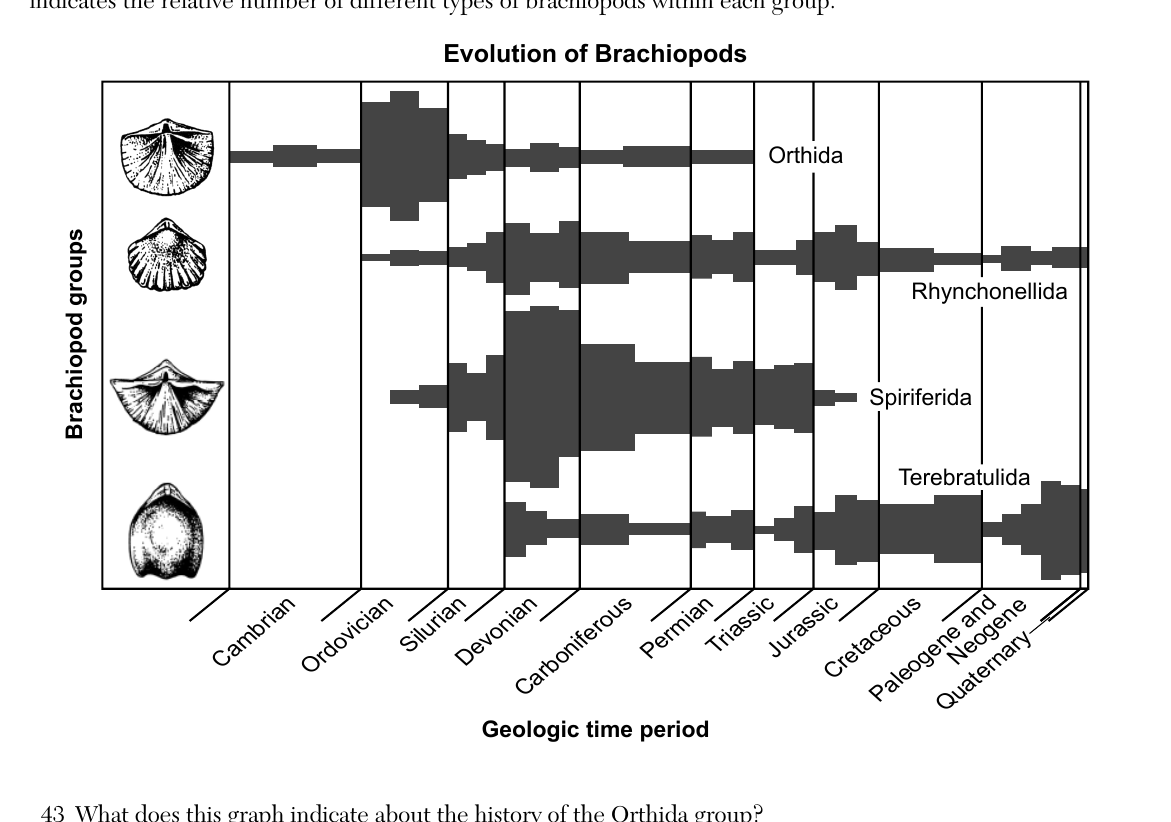
Base your answer on the 'Evolution of Brachiopods' graph described above. Which two other fossil groups found in New York State first appeared on Earth during the same geologic time period that the Orthida Brachiopod group first appeared?
- (A) trilobites and ammonoids
- (B) trilobites and gastropods ✓
- (C) eurypterids and ammonoids
- (D) eurypterids and gastropods
Worked solution
Since the Orthida brachiopods first appear in the Cambrian on the graph, matching this with the ESRT geologic history chart shows trilobites and gastropods are the NY State fossil groups that also first appeared in the Cambrian.
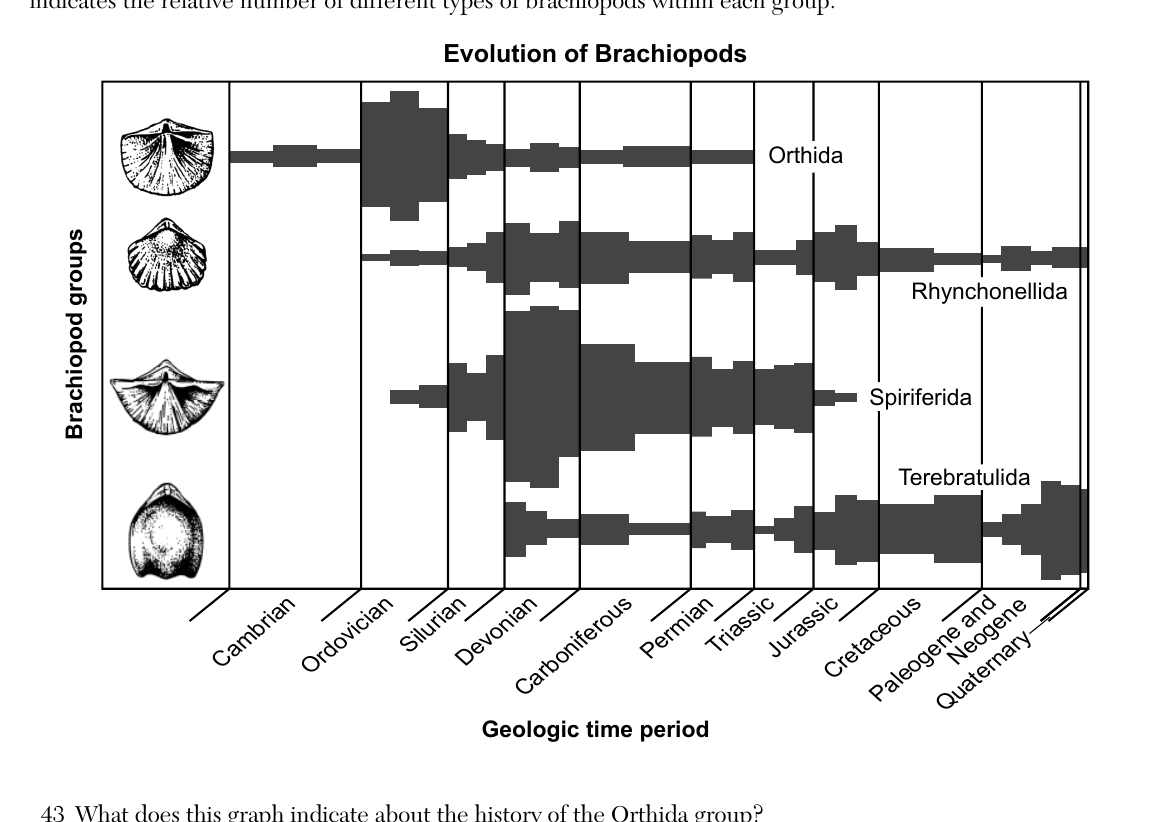
Base your answers to questions 43 through 45 on the graph below and on your knowledge of Earth science. The graph indicates changes in the number of four different brachiopod groups from the early Cambrian to the present. A picture of a representative member of each group is shown in the left column. The width of each bar indicates the relative number of different types of brachiopods within each group. Which brachiopod group had the greatest number of types of organisms existing at the time of existence of the New York State index fossil Platyceras?
- (A) Orthida
- (B) Rhynchonellida
- (C) Spiriferida ✓
- (D) Terebratulida
Worked solution
Platyceras is a Devonian-age index fossil. Reading the graph at the Devonian column, the Spiriferida bar is widest, indicating it had the greatest number of types at that time.
Base your answers to questions 46 through 48 on the contour map below and on your knowledge of Earth science. The contour map shows elevations in meters on the Big Island of Hawaii. The elevation of Mauna Loa, a volcanic mountain, is indicated. The large arrow represents the direction of prevailing winds. Compared to Kailua-Kona, the amount of rainfall received at Hilo is
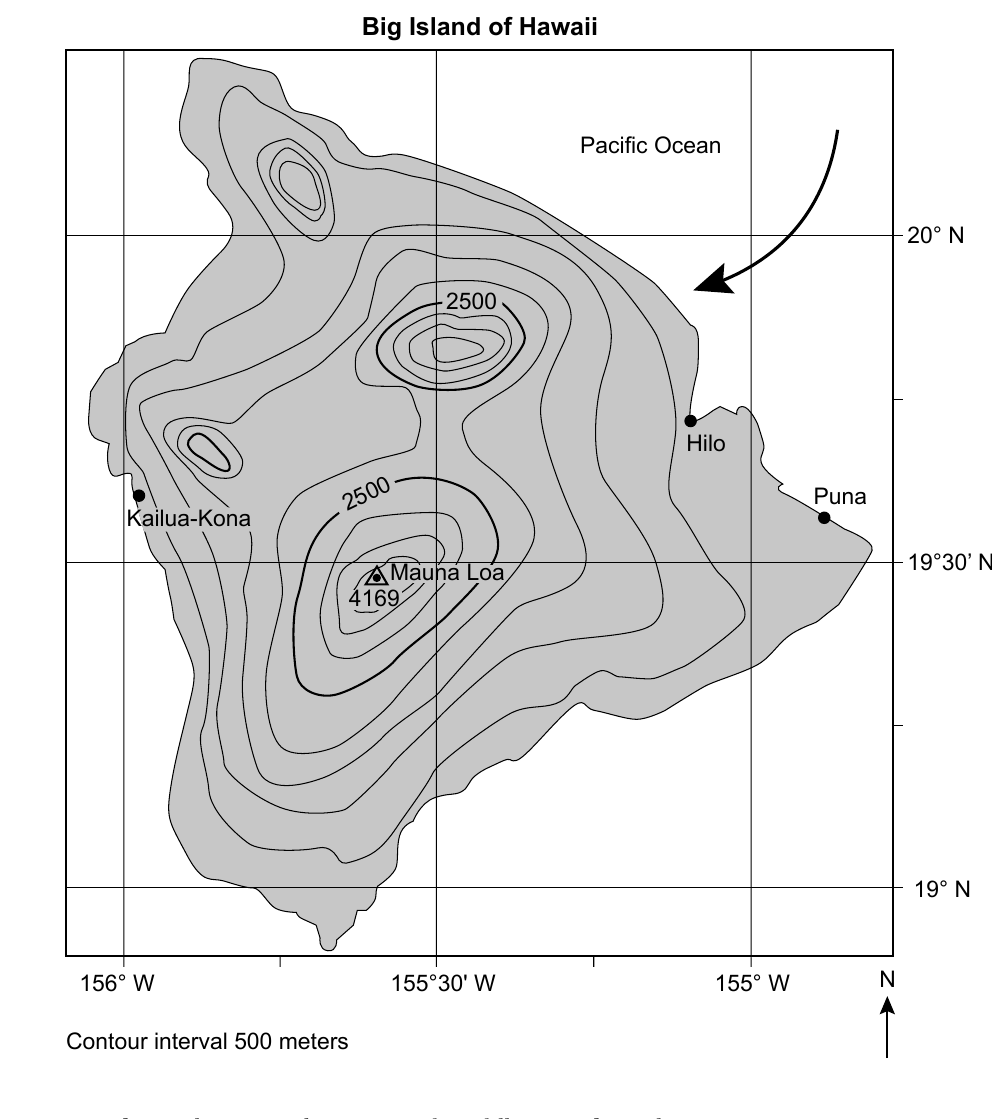
- (A) less due to Hilo being at a lower longitude
- (B) less due to Hilo receiving winds containing less moisture
- (C) greater due to Hilo being at a lower longitude
- (D) greater due to Hilo receiving winds containing more moisture ✓
Worked solution
Hilo is on the windward side facing the ocean, so it receives moisture-laden winds directly off the Pacific, causing greater rainfall than Kailua-Kona on the leeward (drier) side.
After visible light is absorbed by the land surfaces of the Big Island of Hawaii, which form of long-wave electromagnetic energy is radiated?
- (A) x rays
- (B) ultraviolet
- (C) infrared ✓
- (D) gamma rays
Worked solution
Earth's surface absorbs short-wave visible light and re-emits it as long-wave infrared radiation, consistent with the electromagnetic spectrum on the ESRT.
Compared to Puna, Mauna Loa has a cooler climate because Mauna Loa
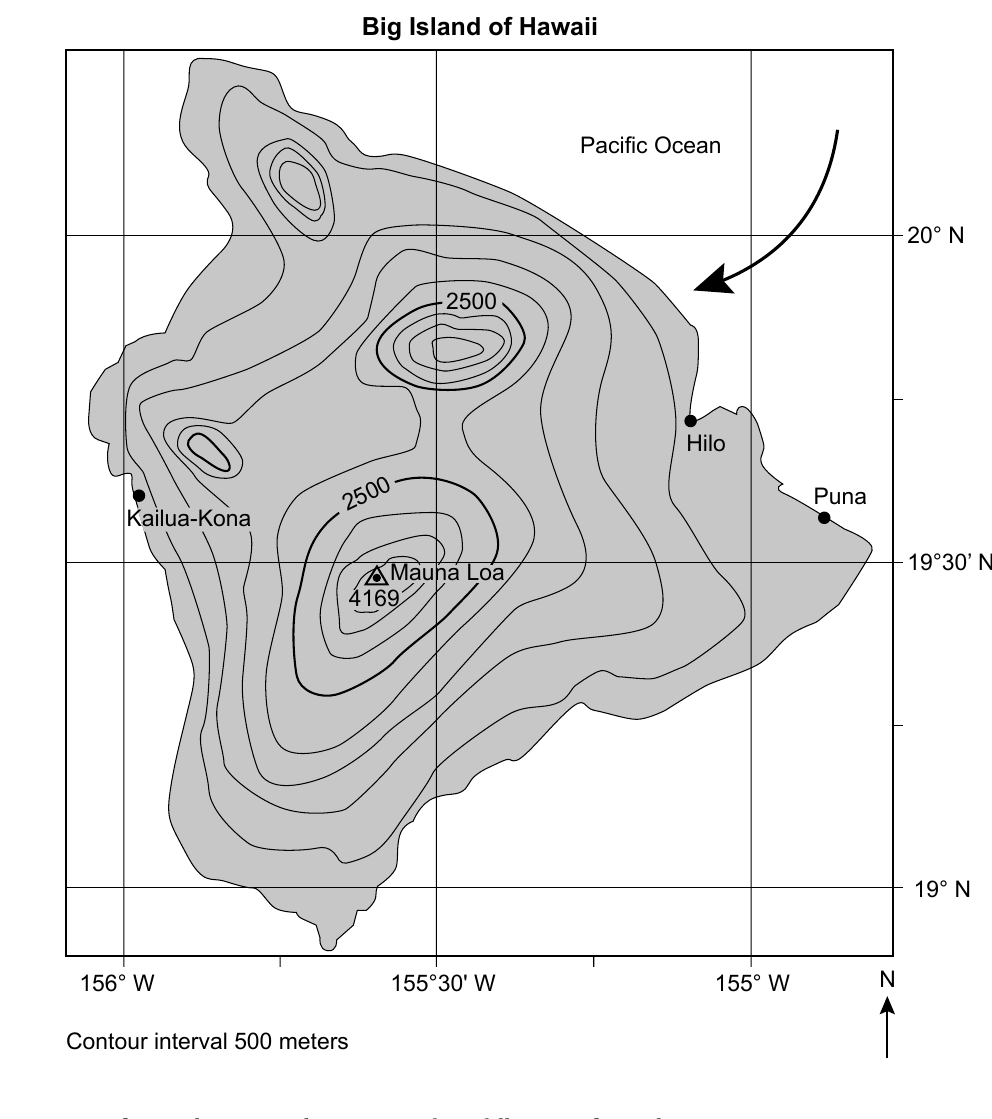
- (A) is farther from the ocean
- (B) has a higher elevation ✓
- (C) is located in a different wind belt
- (D) receives less insolation
Worked solution
Mauna Loa's summit is much higher in elevation than Puna, and temperature decreases with altitude, making its climate cooler.
Base your answers to questions 49 and 50 on the block diagram below and on your knowledge of Earth science. The block diagram shows a portion of Earth's crust and some processes within the water cycle. Letters A, B, C, and D represent different areas and zones on the diagram. Letter X represents a water cycle process. An increase in yearly precipitation would most likely cause
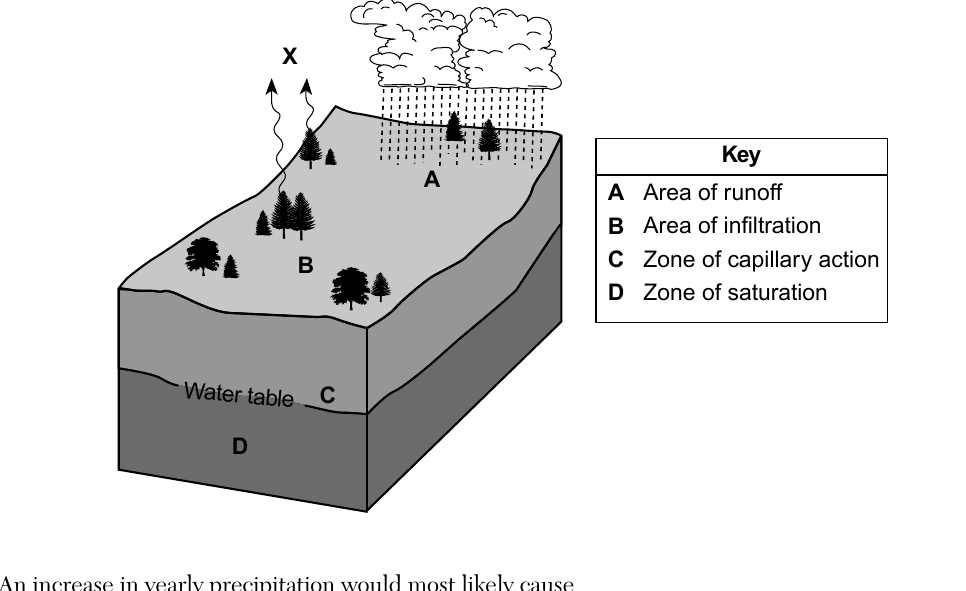
- (A) decreased erosion of soil at area $A$
- (B) decreased infiltration of rainwater at area $B$
- (C) increased groundwater in zone $C$, lowering the water table
- (D) increased groundwater in zone $D$, raising the water table ✓
Worked solution
More precipitation increases infiltration and adds water to the zone of saturation (D), which raises the water table.
Process X, labeled in the diagram, represents
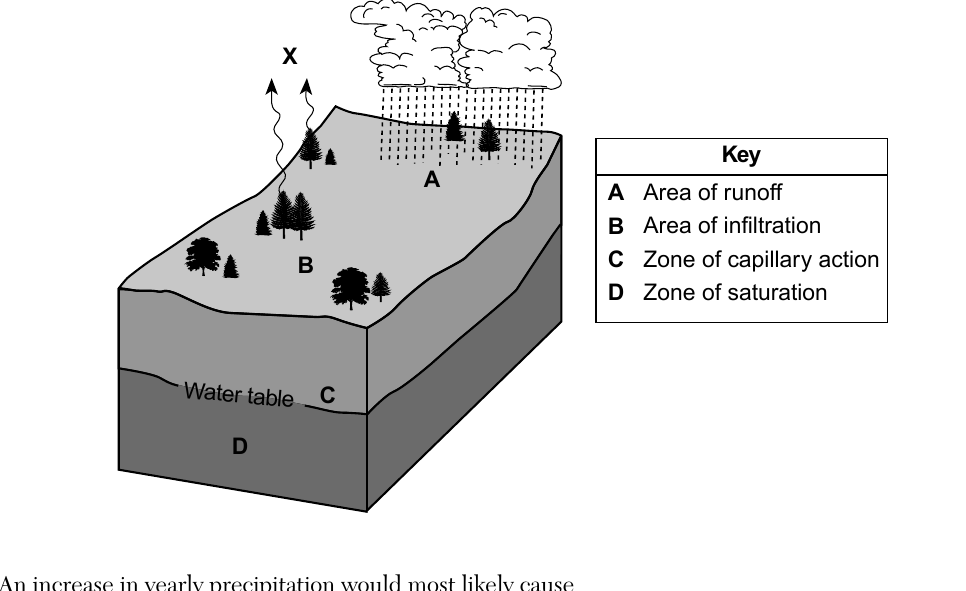
- (A) transpiration ✓
- (B) precipitation
- (C) condensation
- (D) radiation
Worked solution
The upward wavy arrows from the land surface (near vegetation) toward the clouds represent transpiration, the release of water vapor from plants into the atmosphere.
Base your answers to questions 51 through 54 on the passage and diagram below and on your knowledge of Earth science. The diagram represents a developing system indicating the frost line around a protostar (early star). Planet Formation and the Frost Line Our solar system formed in an immense region of gases with metallic and rocky debris known as a nebula. The frost line marks a temperature boundary between the higher temperature region near the protostar (which later became the Sun) and the lower temperature outer region. Temperature determined the types of materials that began to form the early planets. Inside the frost line, closer to the protostar, metallic and rocky materials condensed and solidified into rocky planets. Outside of the frost line, lighter elements and gases condensed, with some solidifying, making the size of these planets larger. The four planets that formed inside of the frost line are referred to as the terrestrial planets. The four planets that formed outside of the frost line are referred to as the Jovian planets. On the graph in your answer booklet, draw a line to represent the general relationship between the distance from a protostar and the temperature in the nebula.
Worked solution
Since the protostar is the heat source, temperature in the nebula is inversely related to distance from it, so the graphed line should start high near the protostar and continuously decrease with increasing distance.
Identify the names of the two planets that formed directly on either side of the frost line.
Worked solution
Mars is the outermost terrestrial (rocky) planet, located just inside the frost line, and Jupiter is the innermost Jovian (gas) planet, located just outside the frost line.
Since the origin of our Solar System, the Sun has evolved from a protostar to its current early stage position in the main sequence. Identify the star classification of our Sun when it will be in the late stage of its development.
Worked solution
According to the Star Evolution diagram in the ESRT, a Sun-mass main sequence star eventually becomes a red giant and then collapses into a white dwarf, which is its late-stage classification.
Identify the nuclear process that produces energy when a protostar becomes a star like our Sun.
Worked solution
When a protostar's core becomes hot and dense enough, nuclear fusion of hydrogen into helium begins, producing the energy that defines it as a main sequence star.
Base your answers to questions 55 and 56 on the geologic cross section below and on your knowledge of Earth science. Numbers 1 through 5 represent rock units. Line AB represents a fault. Lines X and Y represent unconformities. The rock layers have not been overturned. Identify one metamorphic rock that was most likely formed in the zone of contact metamorphism between rock unit 4 and the intrusion.
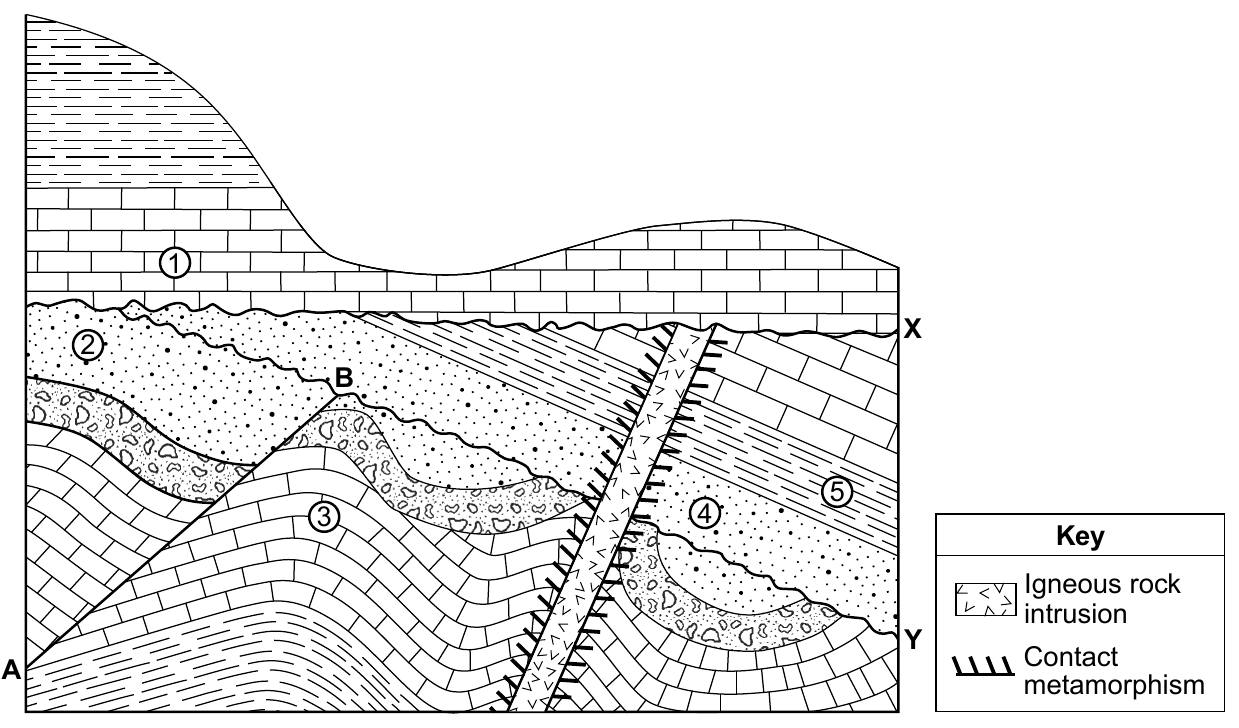
Worked solution
Contact metamorphism from an igneous intrusion heating surrounding rock typically produces hornfels, a fine-grained, nonfoliated metamorphic rock.
Describe one piece of evidence shown in the cross section that indicates layer 3 has undergone crustal movement.
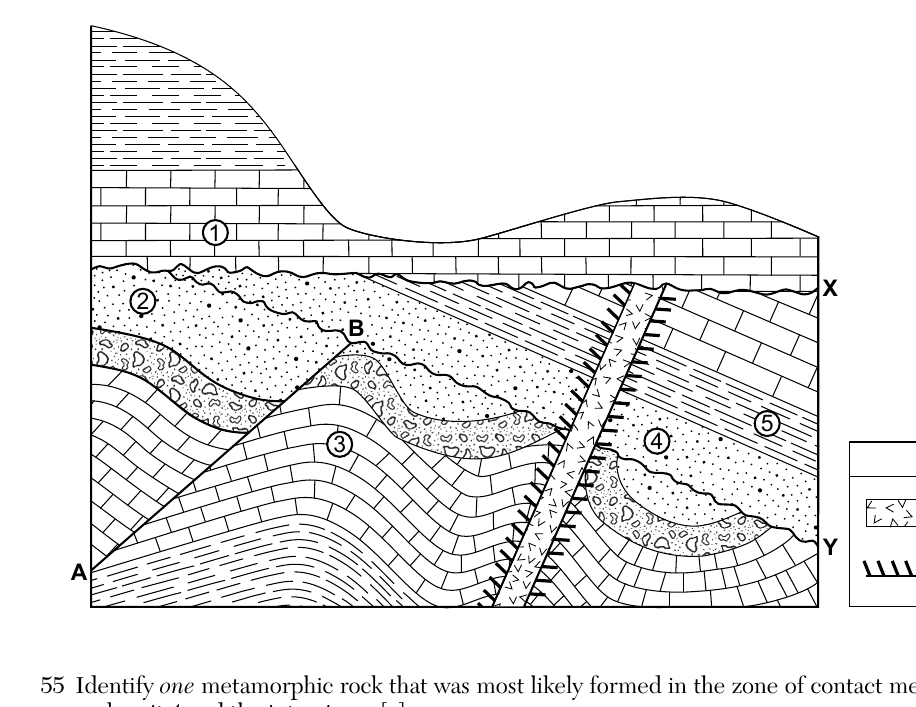
Worked solution
Layer 3 is shown folded rather than lying flat and horizontal as sediments originally deposit, which is direct evidence that crustal (tectonic) forces bent the layer after it formed. Alternatively, its offset across fault AB is also acceptable evidence of crustal movement.
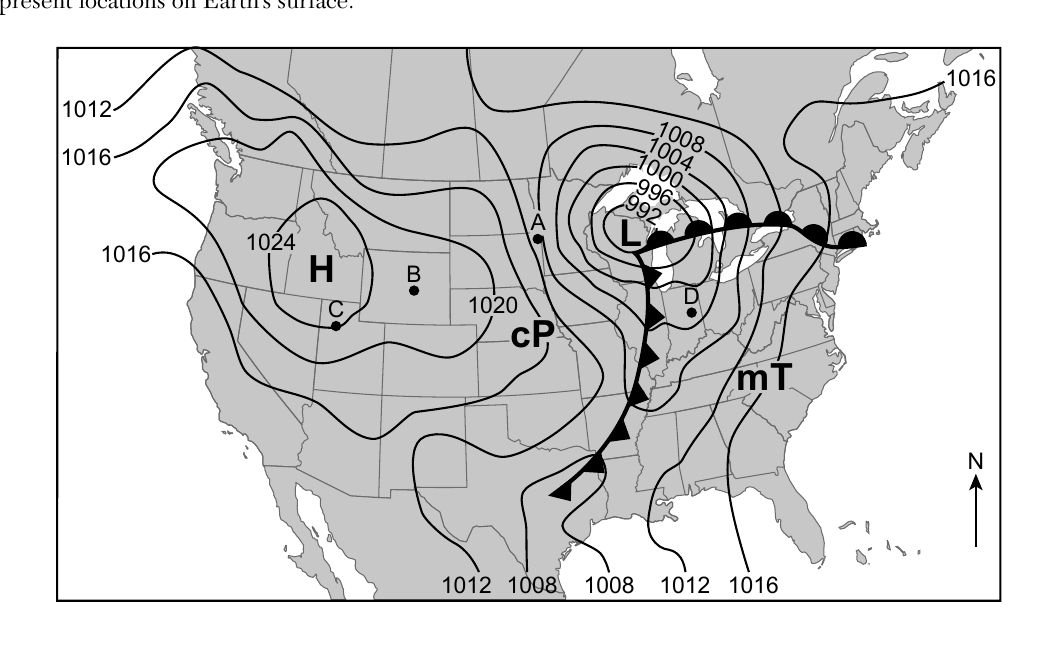
Base your answers to questions 57 through 59 on the weather map below and on your knowledge of Earth science. The weather map shows a high-pressure system (H) and low-pressure system (L). Two different fronts associated with this low-pressure system are indicated. Isobars are in millibars (mb). Points A through D represent locations on Earth's surface. Identify the lettered location on the map, A, B, C, or D, that has the greatest wind speed. Describe one piece of evidence on the map that indicates that this location has the greatest wind speed.
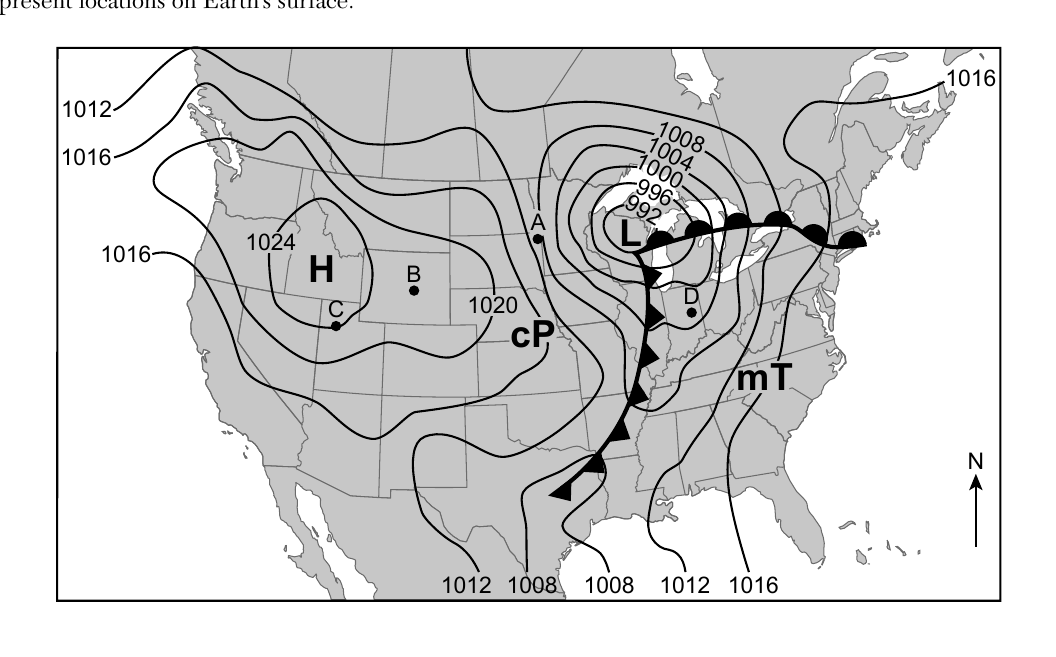
Worked solution
Wind speed correlates with how closely isobars are spaced; point A sits where isobars are packed closest together near the low-pressure center, indicating the steepest pressure gradient and strongest winds.
In your answer booklet, circle one characteristic in each row that describes the general surface wind circulation pattern associated with the high-pressure system.
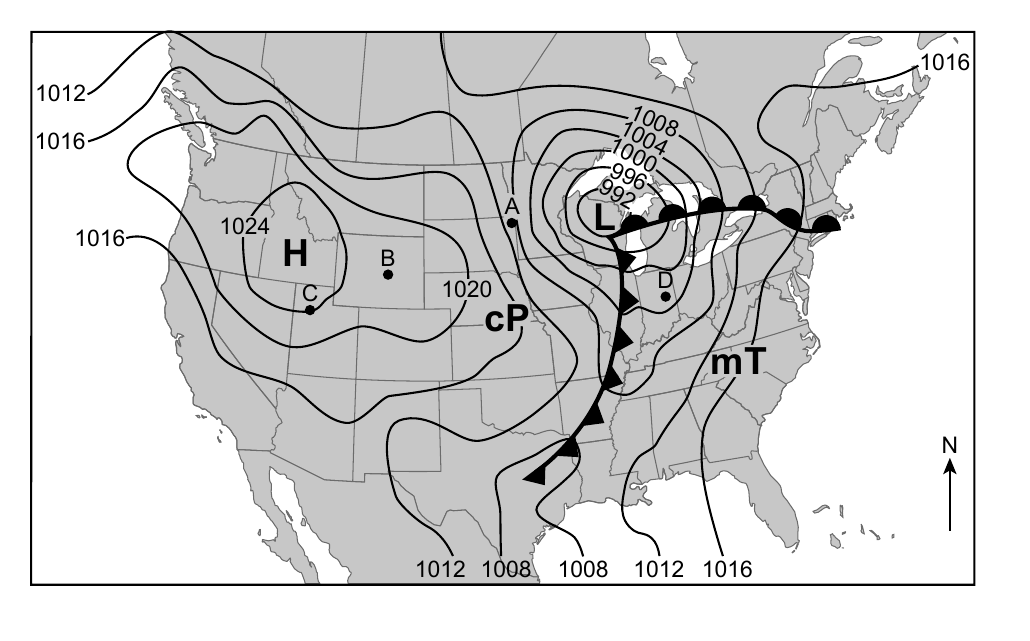
Worked solution
Surface winds around a Northern Hemisphere high-pressure system circulate clockwise and spiral outward (diverge) from the center due to the Coriolis effect and pressure gradient force.
Convert the air pressure of the lowest isobar shown on the map from millibars (mb) to inches of mercury (in of Hg).
Worked solution
The lowest isobar on the map is 992 mb; converting using the standard ratio of 1013.2 mb = 29.92 in of Hg gives approximately 29.29 in of Hg.
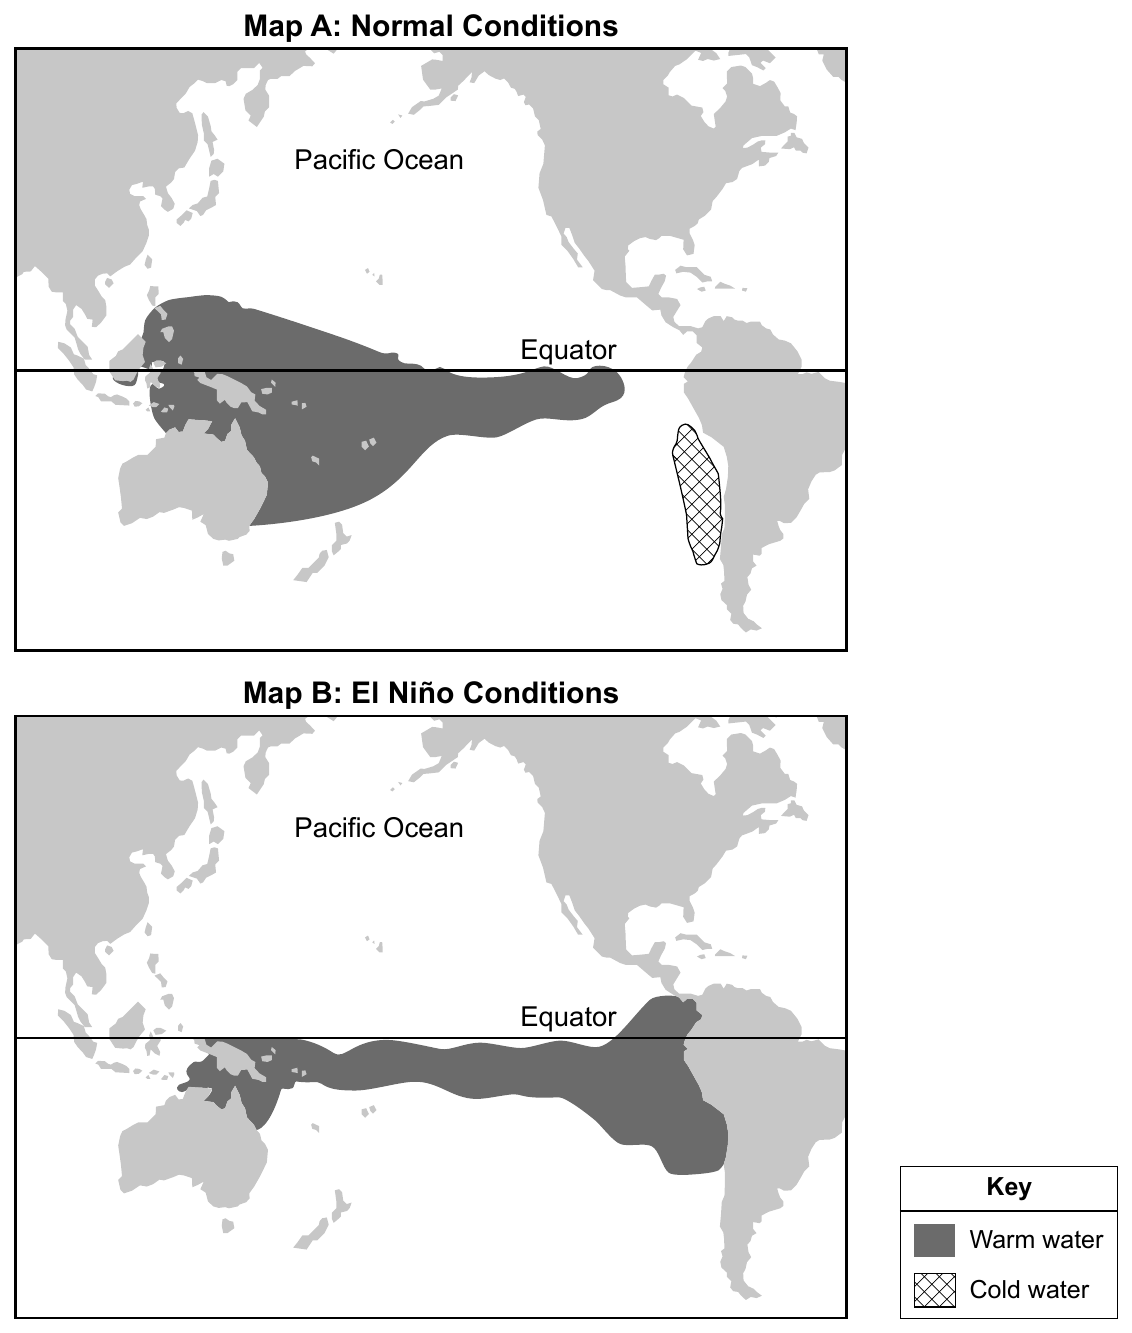
Base your answers to questions 60 and 61 on the maps below and on your knowledge of Earth science. Map A shows warm and cold areas of the Pacific Ocean under normal conditions. Map B shows areas of warmer water under El Nino conditions. Identify the two warm ocean currents that transport water from South America to Australia under normal conditions.
Worked solution
According to the ESRT surface ocean currents map, the North Equatorial Current and South Equatorial Current both flow westward across the Pacific, carrying warm water from near South America toward Australia and Asia under normal conditions.
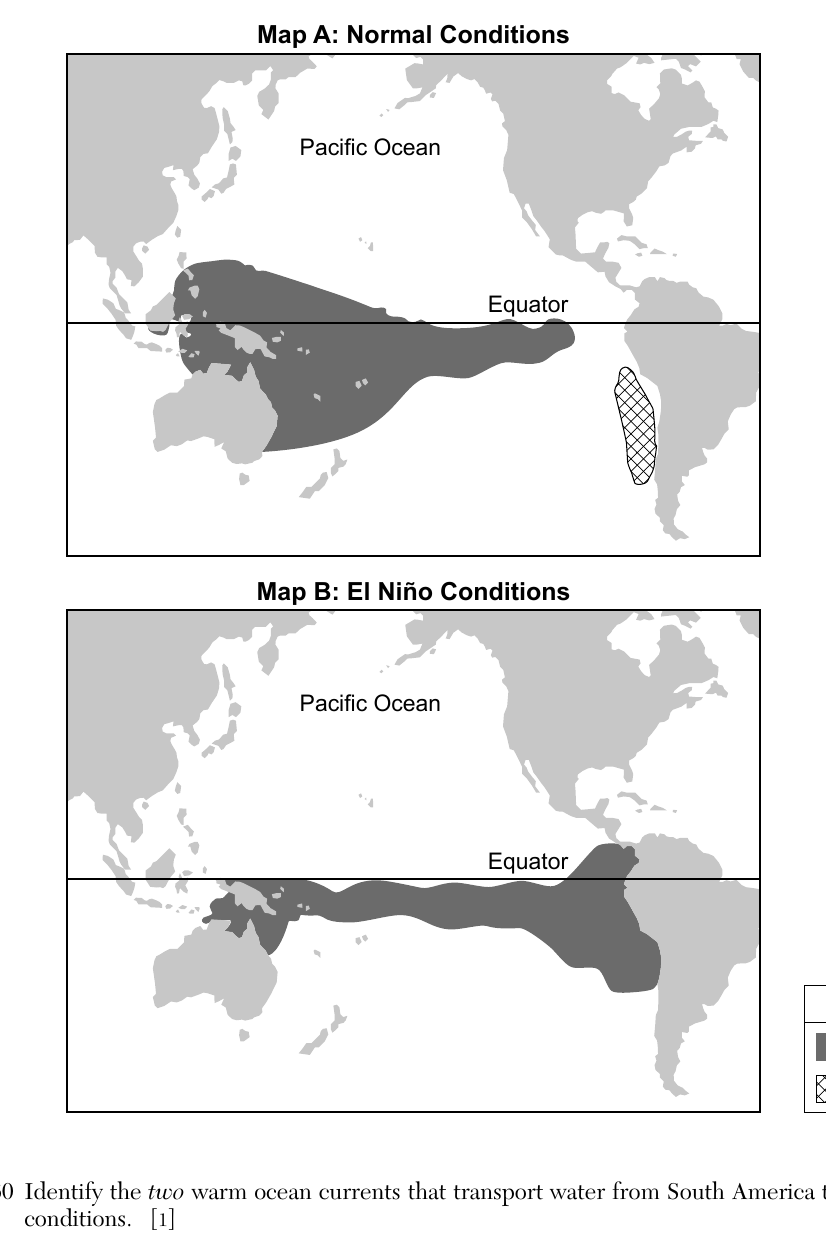
Describe how the relative air temperature and relative amount of precipitation along the west coast of South America are affected by an El Nino event.
Worked solution
El Nino replaces the normally cold coastal water off South America with warm water, which raises air temperatures and increases precipitation along that coast due to greater evaporation and convection.
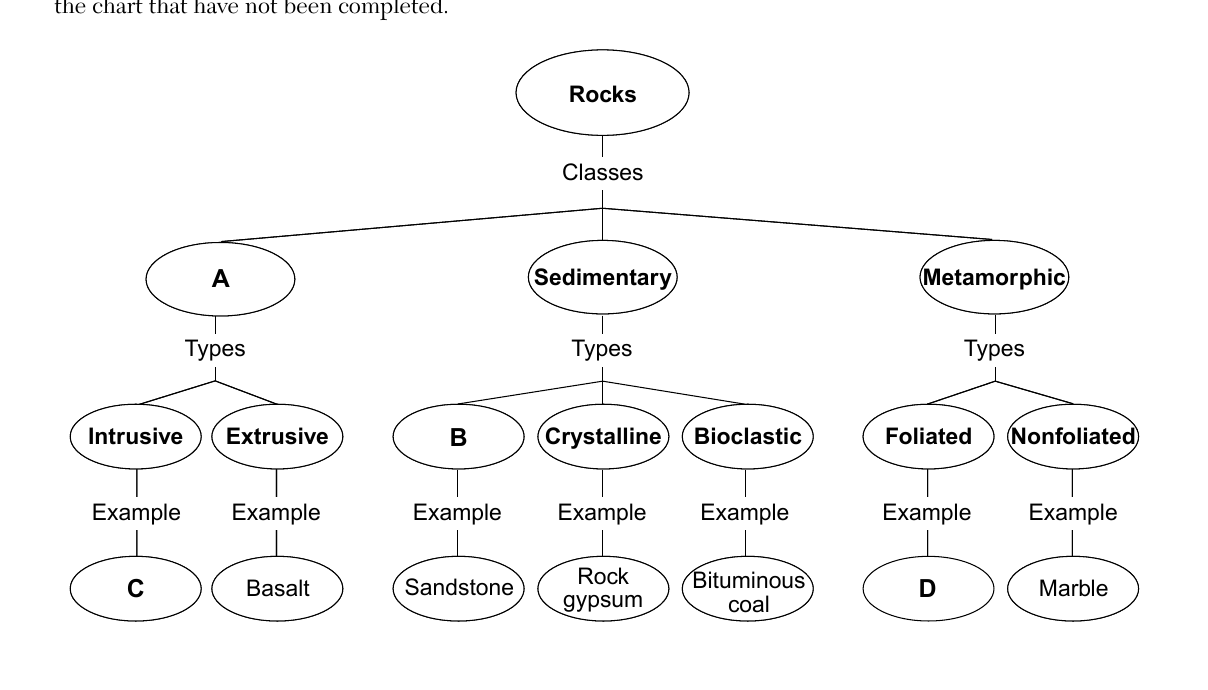
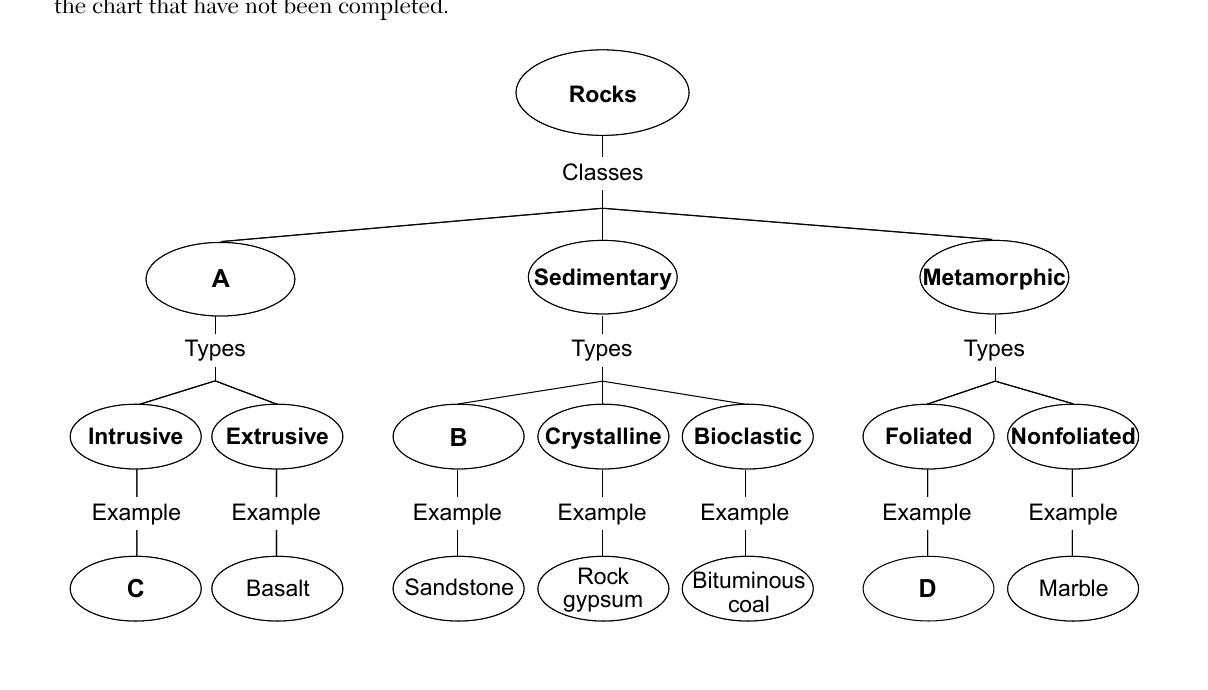
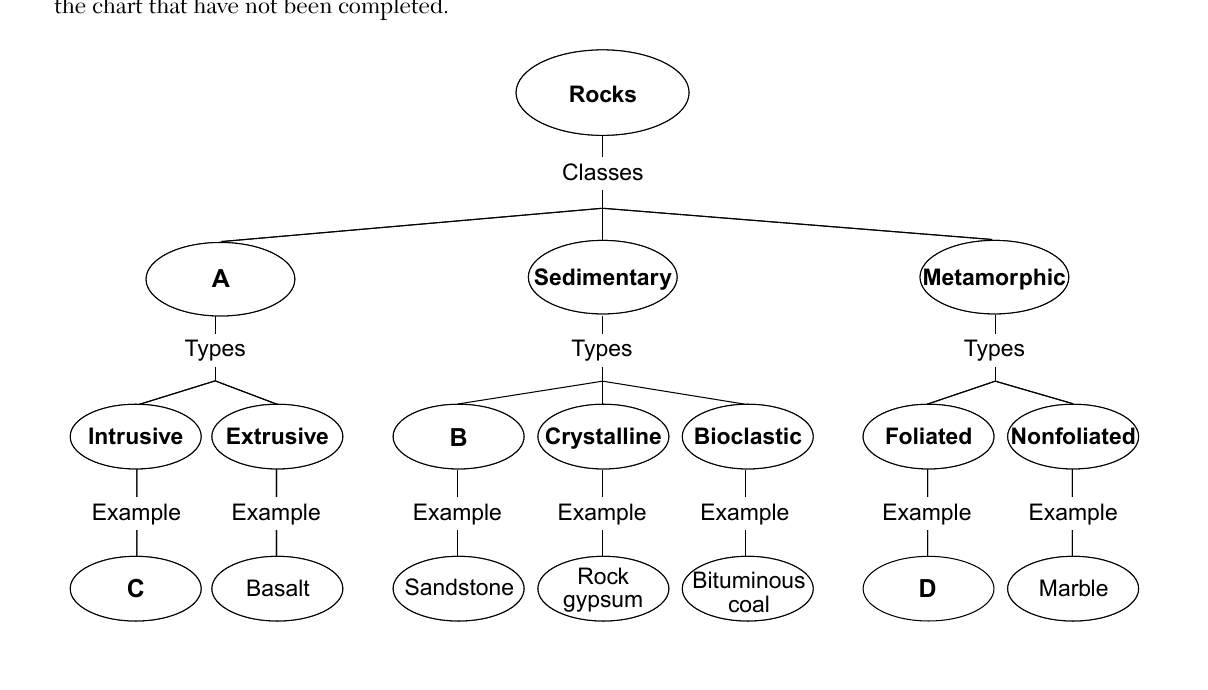
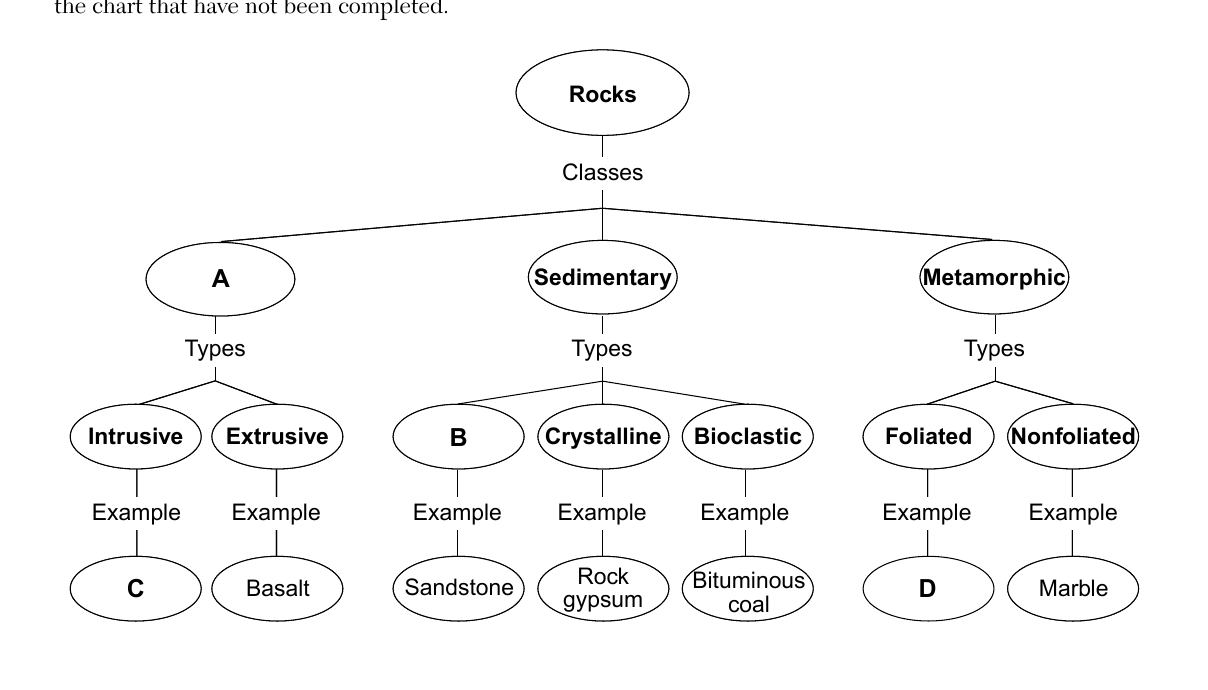
Base your answers to questions 62 through 65 on the flowchart below and on your knowledge of Earth science. The flow chart shows a scheme for classifying rocks. The circled letters A, B, C, and D indicate parts of the chart that have not been completed. Identify two processes necessary to produce the class of rock represented by letter A.
Worked solution
Since Basalt (extrusive) is an example under class A, A must be Igneous rock, which forms through the processes of melting and subsequent cooling/solidification (crystallization) of magma or lava.
State the type of sedimentary rock represented by letter B.
Worked solution
Since Sandstone is the example under B, and sandstone is made of compacted/cemented rock fragments, B represents the clastic (fragmental) type of sedimentary rock.
Compared to the crystal size and cooling rate of the basalt, describe how the crystal size and cooling rate of rock C is different.
Worked solution
Rock C forms intrusively (underground), cooling much more slowly than the extrusive basalt, which results in larger mineral crystals compared to basalt's fine-grained texture.
Rock D is composed of coarse-grained mineral crystals that are arranged in light- and dark-colored distorted bands. State the name of rock D.
Worked solution
A coarse-grained, banded (light and dark distorted bands) foliated metamorphic rock is identified as gneiss according to the ESRT rock identification chart.
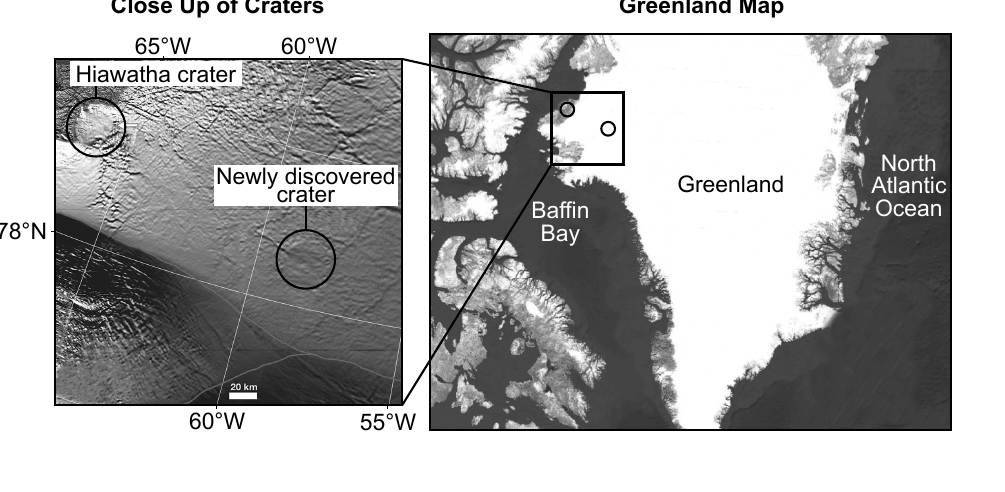
Base your answers to questions 66 through 68 on the map and passage below and on your knowledge of Earth science. The map shows the location of Hiawatha crater and a second newly discovered crater in Greenland. These two craters are found under the glacial ice. Second Crater Found in Greenland In 2019, NASA scientists discovered a second crater under Greenland's ice sheet. Using satellite images of the topography beneath the one-mile thick ice sheet, a visible, circular depression was identified. By studying magnetic and gravitational fields, scientists determined a possible cause. If the crater were formed from a volcano, irregular magnetic patterns would be found in the rocks, but none were found. So scientists infer that this crater formed from an impact event. It was determined that the undisturbed ice covering the crater was 79,000 years old, so the impact event must have occurred prior to this time. Explain why this crater was most likely caused by an impact event instead of a past volcanic eruption.
Worked solution
The passage states that no irregular magnetic patterns, which would be expected from volcanic rock, were found, so scientists ruled out a volcanic origin and concluded the crater was formed by an impact event.
Base your answers to questions 66 through 68 on the map and passage below and on your knowledge of Earth science. The map shows the location of Hiawatha crater and a second newly discovered crater in Greenland. These two craters are found under the glacial ice. Second Crater Found in Greenland In 2019, NASA scientists discovered a second crater under Greenland's ice sheet. Using satellite images of the topography beneath the one-mile thick ice sheet, a visible, circular depression was identified. By studying magnetic and gravitational fields, scientists determined a possible cause. If the crater were formed from a volcano, irregular magnetic patterns would be found in the rocks, but none were found. So scientists infer that this crater formed from an impact event. It was determined that the undisturbed ice covering the crater was 79,000 years old, so the impact event must have occurred prior to this time. 67 Identify one possible effect on Earth of a major impact event.
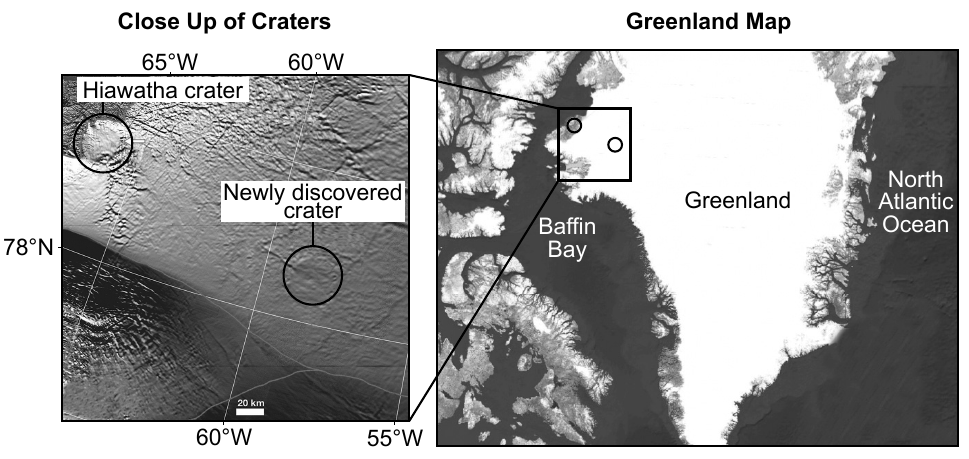
Worked solution
Any single well-supported consequence of a large impact event (fires, tsunamis, earthquakes, climate cooling/impact winter, mass extinction) earns credit.
(Continuing the passage about the Greenland craters.) 68 Identify one climate factor that most likely contributes to the cold climate of Greenland.
The map shows the location of Hiawatha crater and a second newly discovered crater in Greenland. These two craters are found under the glacial ice. Second Crater Found in Greenland In 2019, NASA scientists discovered a second crater under Greenland's ice sheet. Using satellite images of the topography beneath the one-mile thick ice sheet, a visible, circular depression was identified. By studying magnetic and gravitational fields, scientists determined a possible cause. If the crater were formed from a volcano, irregular magnetic patterns would be found in the rocks, but none were found. So scientists infer that this crater formed from an impact event. It was determined that the undisturbed ice covering the crater was 79,000 years old, so the impact event must have occurred prior to this time.
Worked solution
Acceptable climate factors include high latitude, high elevation, or high albedo from snow/ice cover, any one of which contributes to Greenland's cold climate.
Base your answers to questions 69 through 72 on the topographic map in your answer booklet, which shows elevations in meters, and on your knowledge of Earth science. The 700-meter and 800-meter contour lines in the western portion of this map are incomplete. Line AB is a reference line on the map. 69 On the map in your answer booklet, complete the 700-meter and 800-meter contour lines in the western portion of this map. Extend the lines to the edge of the map.
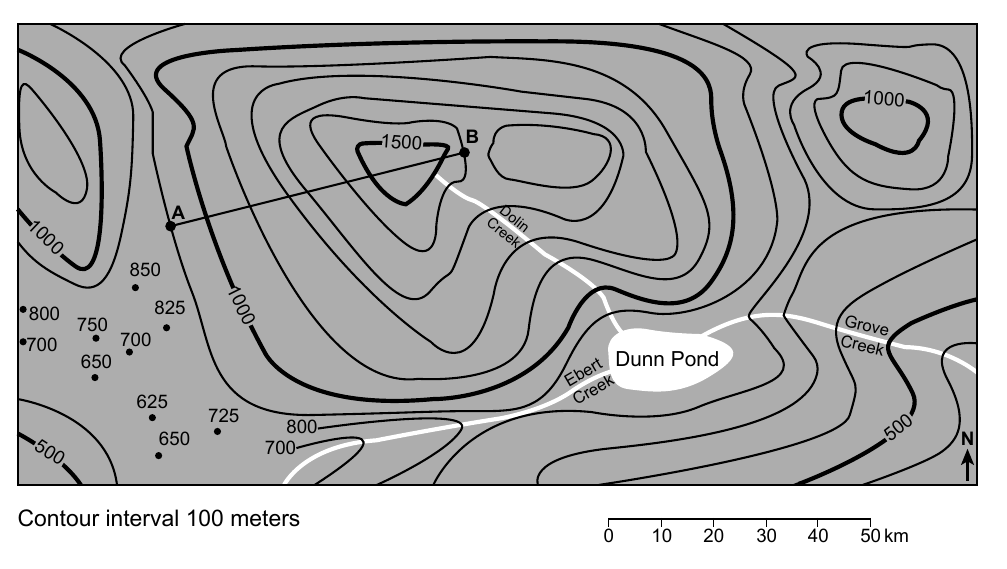
Worked solution
Full credit requires both contour lines drawn following proper contour rules and reaching the map's western edge; exact path depends on the map provided in the answer booklet.
On the grid in your answer booklet, construct a topographic profile along line AB by plotting the elevation of all seven contour lines that cross line AB. Elevations for points A and B have been plotted. Connect all nine plots from A to B.
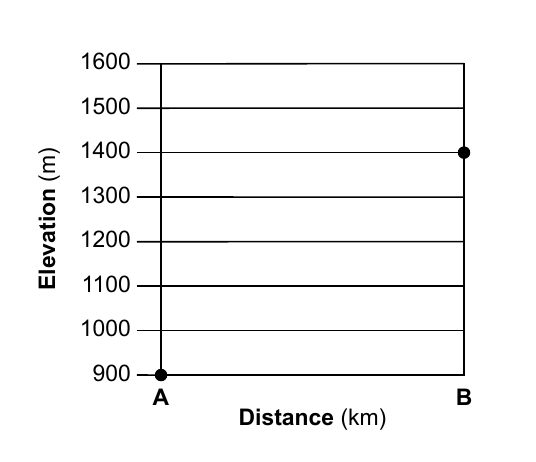
Worked solution
Full credit requires all nine points plotted at the correct elevations/positions and connected in the correct order forming a smooth profile; the exact values depend on the map in the answer booklet.
Identify one possible elevation for the surface of Dunn Pond.
Worked solution
Credit is given for any elevation within the correct range implied by the contour lines enclosing Dunn Pond on the map; the exact numeric range depends on the map in the answer booklet.
On the table in your answer booklet, place an X in one box in each row to indicate whether each creek is flowing into or out of Dunn Pond.
Worked solution
Correctly marking each creek's flow direction requires reading the contour elevations that cross each creek on the answer-booklet map.
Base your answers to questions 73 through 76 on the passage and diagram below and on your knowledge of Earth science. The diagram represents the formation of a pyrocumulonimbus cloud. Some parts of the diagram are labeled. Pyrocumulonimbus Clouds Normally, cool air keeps smoke from rising high in the atmosphere. However, very intense fires can create giant storm clouds, called pyrocumulonimbus clouds, that can reach heights up to 23 kilometers. Smoke and soot (black carbon particles) can remain at these heights for months and sometimes damage the ozone layer. 73 On the diagram in your answer booklet, place an X on the scale to represent the height in kilometers (km) pyrocumulonimbus clouds can reach. Identify the name of the temperature zone of the atmosphere that corresponds to this height.
The answer booklet diagram includes a vertical height scale in kilometers on which you mark an X at the maximum height stated in the passage (23 km). To name the temperature zone at that height, use the Selected Properties of Earth's Atmosphere chart in the Earth Science Reference Tables: | Temperature Zone | Approximate Altitude Range | |---|---| | Troposphere | 0 to about 12 km | | Stratosphere | about 12 km to 50 km | | Mesosphere | about 50 km to 80 km | | Thermosphere | above about 80 km |
Worked solution
The 23 km height given in the passage falls within the stratosphere, the atmospheric layer that contains the ozone layer mentioned in the passage.
A damaged ozone layer can have harmful effects on organisms on Earth. Explain how the ozone layer reduces these harmful effects.
Worked solution
The ozone layer's key protective function is UV absorption, shielding life on Earth from harmful radiation.
Explain how an increase in smoke and soot in the atmosphere normally decreases temperatures on Earth's surface.
Worked solution
Aerosols like smoke and soot typically cool the surface by reflecting/blocking sunlight, reducing the insolation that would otherwise warm the ground.
As the wildfires burn, large amounts of carbon dioxide are released into the atmosphere. Explain why scientists are concerned with the release of carbon dioxide into Earth's atmosphere.
Worked solution
Scientists are concerned because added atmospheric CO2 strengthens the greenhouse effect, raising global average temperatures and altering climate.
Base your answers to questions 77 through 80 on the passage and diagram below and on your knowledge of Earth science. The diagram compares the sizes of seven exoplanets located outside of our solar system in the Trappist-1 system to the sizes of the first four planets in our solar system. Line XY is drawn to indicate the size of the Trappist-1 system if it were located within our own solar system and centered around our Sun. Trappist-1 Exoplanets NASA's Spitzer Space Telescope has revealed seven Earth-sized exoplanets (identified by letters b through h) revolving around a star named Trappist-1. Located about 235 trillion miles from Earth, this system of exoplanets is within our galaxy and can be observed in the constellation Aquarius. Trappist-1 is classified as a dwarf star, with a size that is approximately one-tenth the size of the Sun, and with a surface temperature of approximately 2500 K. All seven of the Trappist-1 planetary orbits are much closer to their host star than Mercury is to our Sun. 77 State the color of the star Trappist-1.
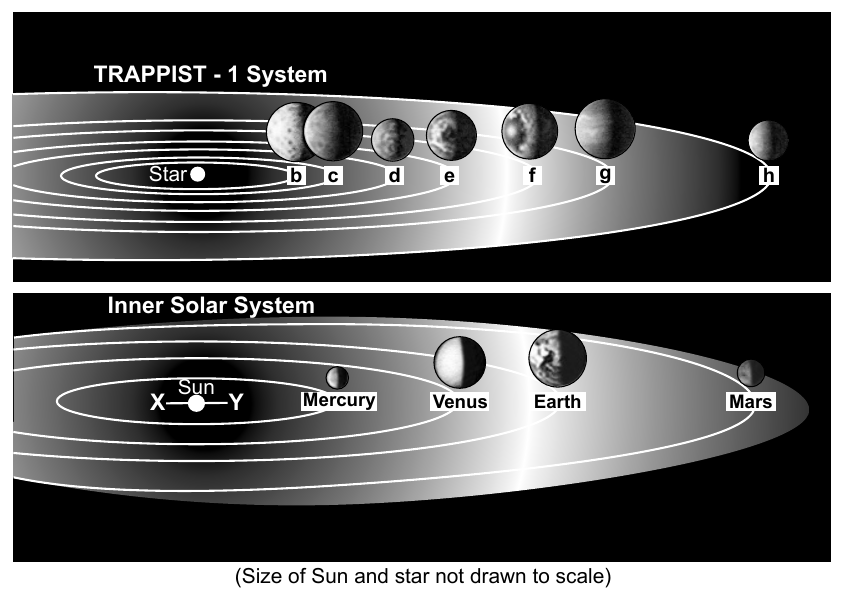
Worked solution
Cooler stars (lower surface temperature) appear red, per the standard star color-temperature relationship; Trappist-1's ~2500 K places it in the red range.
Identify the planet in our solar system that has a diameter closest to the estimated diameter of the star Trappist-1.
Worked solution
Calculating one-tenth of the Sun's diameter gives a value close to Jupiter's actual diameter, making Jupiter the best match among solar system planets.
Exoplanet Trappist-1g orbits its star in 12.35 days. Explain why this exoplanet orbits its star in less time than it takes Mercury to orbit our Sun.
The diagram compares the sizes of seven exoplanets located outside of our solar system in the Trappist-1 system to the sizes of the first four planets in our solar system. Line XY is drawn to indicate the size of the Trappist-1 system if it were located within our own solar system and centered around our Sun. Trappist-1 Exoplanets NASA's Spitzer Space Telescope has revealed seven Earth-sized exoplanets (identified by letters b through h) revolving around a star named Trappist-1. Located about 235 trillion miles from Earth, this system of exoplanets is within our galaxy and can be observed in the constellation Aquarius. Trappist-1 is classified as a dwarf star, with a size that is approximately one-tenth the size of the Sun, and with a surface temperature of approximately 2500 K. All seven of the Trappist-1 planetary orbits are much closer to their host star than Mercury is to our Sun.
Worked solution
Shorter orbital distance directly produces a shorter orbital period, explaining why Trappist-1g's 12.35-day orbit is faster than Mercury's roughly 88-day orbit.
These exoplanets were discovered because the light from Trappist-1 was observed to dim slightly every time an orbiting planet transited (passed in front of) the star. Identify one natural celestial object in our solar system that transits our Sun and temporarily reduces the light that reaches Earth.
Worked solution
Any celestial body that periodically crosses in front of the Sun as viewed from Earth (Venus, Mercury, or the Moon during an eclipse) is an acceptable answer.
Base your answers to questions 81 through 83 on the photographs below and on your knowledge of Earth science. The photographs show samples of sandstone, labeled A through D. (Not drawn to scale) 81 Identify the letter of the sandstone sample that most likely underwent the greatest amount of erosion by a stream and identify evidence shown in the photographs that supports this choice.
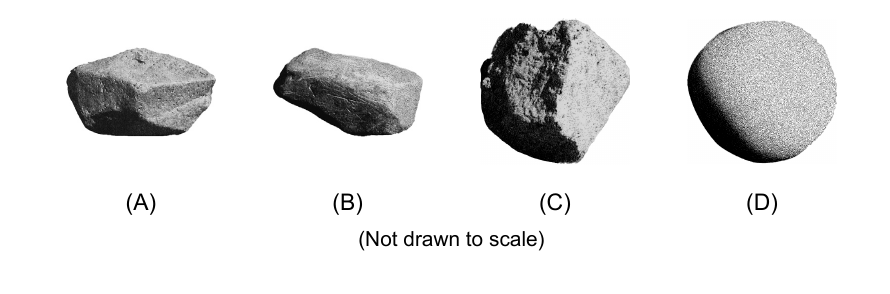
Worked solution
Roundness is the key visual evidence of erosion; the most rounded, sphere-like sample (D) shows the greatest amount of stream erosion/abrasion.
Sandstone sample C is 2.0 centimeters in diameter. Determine the minimum stream velocity needed to transport this rock sample.
The photographs show samples of sandstone, labeled A through D. (Not drawn to scale)
Worked solution
The Reference Tables graph relating grain diameter to required stream velocity gives roughly 100 cm/sec as the minimum velocity to transport a 2.0 cm particle.
Identify the complete range of grain sizes that could be found in each of these rock samples.
The photographs show samples of sandstone, labeled A through D. (Not drawn to scale)
Worked solution
By definition, sandstone must be composed only of sand-sized grains, whose diameter range (0.006-0.2 cm) is given in the particle size scale of the Reference Tables.
Base your answers to questions 84 and 85 on the data table and Saffir-Simpson Hurricane Scale below, on the map in your answer booklet, and on your knowledge of Earth science. The data table shows latitude and longitude locations of the center of Hurricane Dorian, and the maximum sustained wind speed in miles per hour (mph), each day from August 24 to September 7, 2019. The Saffir-Simpson Hurricane Scale shows the wind speeds associated with each storm category. The map in your answer booklet shows the location of the hurricane from August 24, 2019 through August 31, 2019. Data table (Date: Latitude, Longitude, Maximum sustained wind speed): Aug. 24, 2019: 10.7°N, 49.1°W, 40 mph Aug. 25, 2019: 11.5°N, 54.2°W, 50 mph Aug. 26, 2019: 12.7°N, 58.8°W, 60 mph Aug. 27, 2019: 15.3°N, 62.5°W, 50 mph Aug. 28, 2019: 18.8°N, 65.5°W, 80 mph Aug. 29, 2019: 22.5°N, 67.7°W, 85 mph Aug. 30, 2019: 25.0°N, 70.7°W, 115 mph Aug. 31, 2019: 26.2°N, 74.4°W, 150 mph Sept. 1, 2019: 26.6°N, 77.3°W, 185 mph Sept. 2, 2019: 26.8°N, 78.4°W, 145 mph Sept. 3, 2019: 27.7°N, 78.7°W, 110 mph Sept. 4, 2019: 30.6°N, 79.8°W, 110 mph Sept. 5, 2019: 33.1°N, 78.5°W, 105 mph Sept. 6, 2019: 36.9°N, 72.7°W, 90 mph Sept. 7, 2019: 43.9°N, 63.9°W, 100 mph Saffir-Simpson Hurricane Scale (Classification: Wind Speed mph): Tropical Depression: 0-38 Tropical Storm: 39-73 Category 1 (Hurricane): 74-95 Category 2 (Hurricane): 96-110 Category 3 (Hurricane): 111-130 Category 4 (Hurricane): 131-155 Category 5 (Hurricane): >156 84 On the map in your answer booklet, complete the path of Hurricane Dorian by plotting the location of the storm center for September 1 through September 7. Draw a line to connect all seven of these plots to the August 31 plot to complete the path.
Worked solution
All seven September data points must be plotted at their correct lat/long positions and connected sequentially to the existing path ending on August 31.
Use the Saffir-Simpson scale to identify the two dates when Hurricane Dorian changed from a category 4 hurricane to a category 5 hurricane.
Worked solution
Comparing consecutive daily wind speeds to the Saffir-Simpson scale shows the storm crossed from Category 4 (150 mph) on Aug. 31 to Category 5 (185 mph) on Sept. 1.