June 2024 Earth Science Regents — Answer Key & Worked Solutions
Every question from the June 2024 Earth Science Regents exam, with the correct answer and a full step-by-step solution. Check your work, learn the method, then convert your raw score.
These are real questions from the June 2024 Earth Science New York State Regents examination, published by NYSED. Worked solutions are written by RegentsLab.
The diagrams below represent the atmosphere and inferred interior structure of the planet Uranus. Which two factors caused the inferred layered structure of this planet in our solar system?
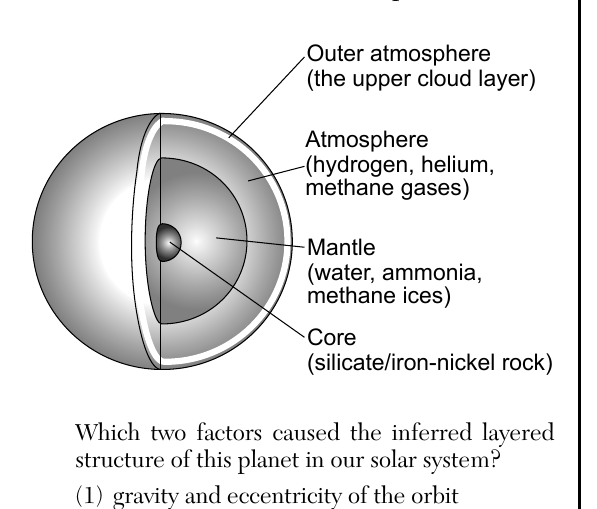
- (A) gravity and eccentricity of the orbit
- (B) gravity and density differences of materials ✓
- (C) period of rotation at equator and eccentricity of the orbit
- (D) period of rotation at equator and density differences of materials
Worked solution
Planetary layering forms because gravity draws all material inward while materials of different densities settle into distinct layers, with the densest (rock/metal) sinking to the core.
Which process occurring in the Sun produces energy by converting lighter hydrogen into heavier helium?
- (A) radiation
- (B) conduction
- (C) radioactive decay
- (D) nuclear fusion ✓
Worked solution
Nuclear fusion is the process in the Sun's core where hydrogen nuclei combine under extreme heat and pressure to form helium, releasing energy.
Compared to the sizes and periods of revolution of the terrestrial planets, the Jovian planets have
- (A) smaller sizes and shorter periods of revolution
- (B) smaller sizes and longer periods of revolution
- (C) larger sizes and shorter periods of revolution
- (D) larger sizes and longer periods of revolution ✓
Worked solution
The Jovian (gas giant) planets are much larger in diameter than the terrestrial planets and, being farther from the Sun, take much longer to complete one orbit.
The photograph below shows a dust-covered, icy object that has a highly elliptical orbit in our solar system. This celestial object is most likely a
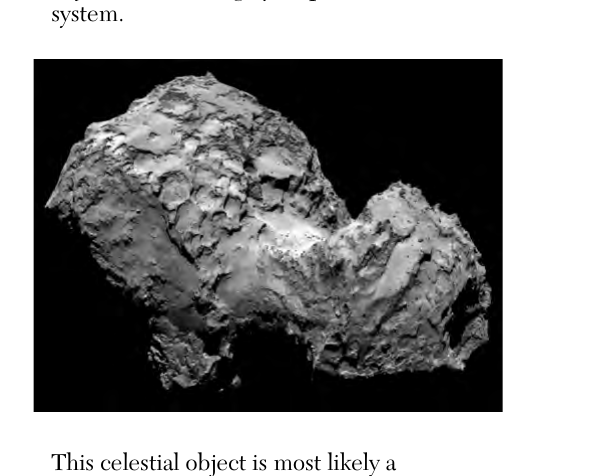
- (A) comet that leaves a trail of particles in space ✓
- (B) meteor that leaves a trail of light across the sky
- (C) moon that revolves around a planet
- (D) planet that revolves around the Sun
Worked solution
Comets are icy, dusty bodies with highly elliptical orbits that develop a trail of gas and dust particles as they near the Sun.
At which location will the Sun appear to pass directly overhead for an observer?
- (A) northern Asia
- (B) northern Australia ✓
- (C) southern Greenland
- (D) southern Antarctica
Worked solution
The Sun can only appear directly overhead at locations between 23.5 degrees N and 23.5 degrees S latitude; only northern Australia falls within this tropical band.
The hydrosphere covers approximately
- (A) 70% of Earth's atmosphere
- (B) 70% of Earth's lithosphere ✓
- (C) 85% of Earth's atmosphere
- (D) 85% of Earth's lithosphere
Worked solution
Earth's surface, part of the lithosphere, is covered by water (the hydrosphere) over approximately 70% of its area.
The photograph below shows a one-mile diameter feature on Earth's surface. What is this feature, and how was it formed?
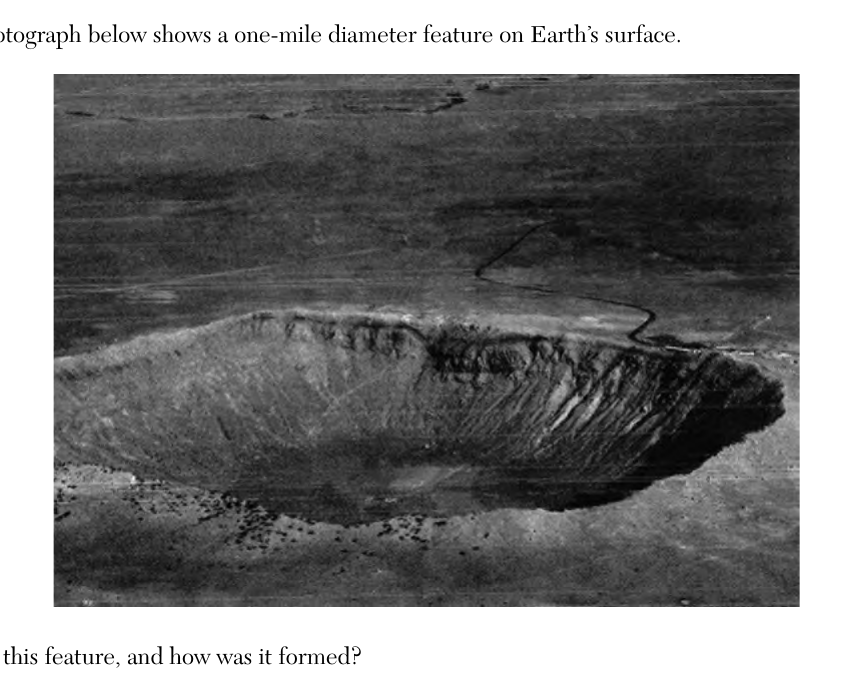
- (A) dry kettle lake, formed from an impact event
- (B) dry kettle lake, formed from a retreating glacier
- (C) crater, formed from an impact event ✓
- (D) crater, formed from a retreating glacier
Worked solution
The circular, bowl-shaped depression with an elevated rim is characteristic of a meteorite impact crater, not a glacially formed kettle lake.
The time-lapse photograph below shows stars as they appear to move around the central star Polaris. Polaris does not appear to move in the nighttime sky because Polaris is located
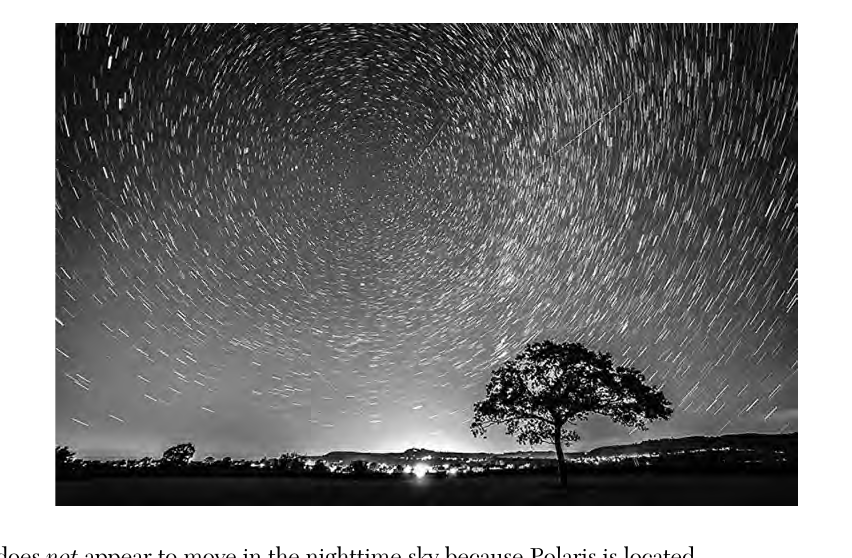
- (A) in our solar system
- (B) in our galaxy
- (C) above Earth's axis of rotation ✓
- (D) above Earth's equator
Worked solution
Polaris appears fixed because it is positioned almost directly above Earth's axis of rotation, so Earth's spin does not change its apparent position.
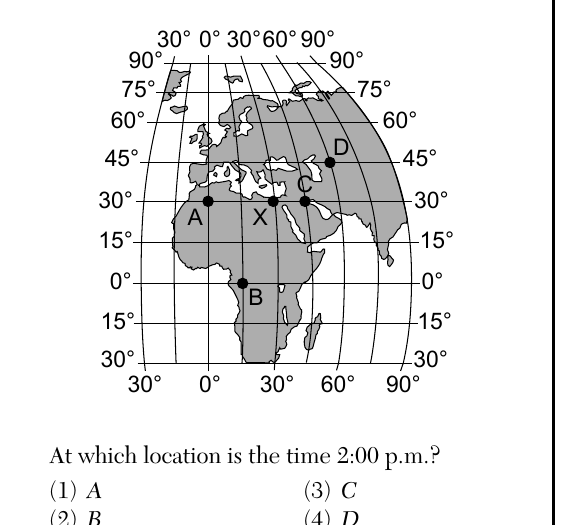
The map below shows five locations, labeled A, B, C, D, and X, on Earth's surface. Solar noon is occurring at location X. At which location is the time 2:00 p.m.?
- (A) A
- (B) B
- (C) C
- (D) D ✓
Worked solution
Since Earth rotates 15 degrees of longitude per hour, a location 30 degrees east of X (where it is solar noon) will already be experiencing 2:00 p.m.; that location is D.
Approximately how many degrees per day does Earth move in its orbit around the Sun?
- (A) 1°/day ✓
- (B) 15°/day
- (C) 24°/day
- (D) 360°/day
Worked solution
Earth completes one 360-degree orbit around the Sun in about 365 days, which works out to roughly 1 degree of orbital movement per day.
Which motion explains why some constellations appear in the night sky only during specific seasons?
- (A) The Sun revolves around Earth.
- (B) Earth revolves around the Sun. ✓
- (C) Constellations revolve around Earth.
- (D) Constellations revolve around the Sun.
Worked solution
Because Earth revolves around the Sun, different portions of the night sky (and thus different constellations) face away from the Sun and become visible at night depending on the season.
What is the relative humidity when the air temperature is 20°C and the wet-bulb temperature is 11°C?
- (A) 9%
- (B) 2%
- (C) 17%
- (D) 30% ✓
Worked solution
The wet-bulb depression is 20°C minus 11°C, or 9°C. On the Earth Science Reference Tables relative humidity chart, the row for a 20°C dry-bulb temperature intersects the 9°C depression column at 30%.
Earth's early atmosphere consisted of carbon dioxide, water vapor, hydrogen, and nitrogen. During this time in Earth's history, the first crust formed and was made of igneous rock. Based on this information, how did Earth's early atmosphere most likely form?
- (A) outgassing from volcanic eruptions ✓
- (B) radioactive decay of igneous rock
- (C) release of gases from plant life
- (D) evaporation of ocean water
Worked solution
Since Earth's first crust was igneous rock, volcanic outgassing (the release of trapped gases during eruptions) is the most likely source of the early atmosphere's gases, as no plants or liquid oceans existed yet.
The subtropical jet streams are located in Earth's
- (A) lower troposphere near 30° N and 30° S
- (B) upper troposphere near 30° N and 30° S ✓
- (C) lower troposphere near 60° N and 60° S
- (D) upper troposphere near 60° N and 60° S
Worked solution
The subtropical jet streams are fast-moving air currents found in the upper troposphere at approximately 30 degrees north and south latitude.
The transfer of heat energy in the oceans due to density differences is best described as
- (A) conduction
- (B) convection ✓
- (C) radiation
- (D) insolation
Worked solution
Convection is the transfer of heat through the movement of a fluid (like ocean water) caused by density differences, typically from temperature or salinity variations.
Which list of Earth materials indicates an increasing order in the amount of energy needed to raise the temperatures of equal masses of the materials by 1°C?
- (A) copper, iron, basalt ✓
- (B) basalt, iron, granite
- (C) iron, copper, lead
- (D) lead, basalt, granite
Worked solution
Using specific heat values from the ESRT, copper has the lowest specific heat, followed by iron, then basalt, so this list correctly orders them from least to most energy needed to raise temperature.
Which color and texture of surfaces with equal areas will have the least temperature increase when heated by the Sun?
- (A) light color and smooth texture ✓
- (B) light color and rough texture
- (C) dark color and smooth texture
- (D) dark color and rough texture
Worked solution
Light-colored, smooth surfaces reflect the most incoming solar radiation and absorb the least, resulting in the smallest temperature increase.
Over the last 200 years, global warming is inferred to be primarily caused by
- (A) strong El Niño conditions
- (B) retreating glaciers
- (C) an increase in greenhouse gases ✓
- (D) an increase in sea level
Worked solution
Scientific consensus attributes recent global warming primarily to human-driven increases in atmospheric greenhouse gas concentrations, which trap more heat; retreating glaciers and rising sea level are effects, not causes.
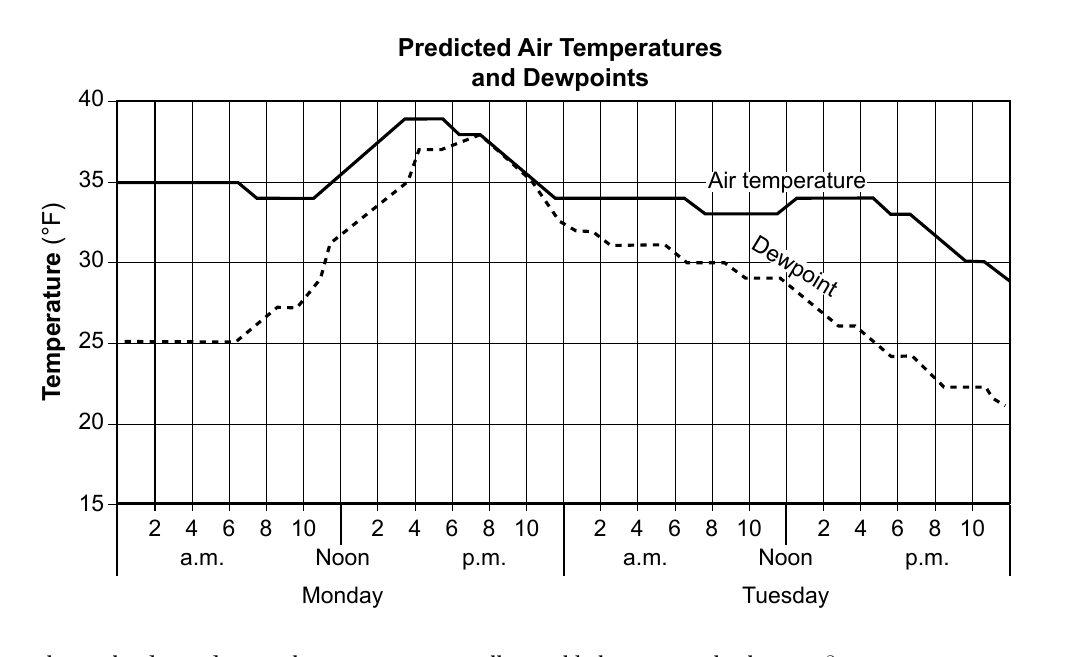
The graph below shows predicted air temperatures and dewpoints for a New York State location during a two-day period. What is the day and time when precipitation will most likely occur at this location?
- (A) Monday at 6:00 a.m.
- (B) Monday at 8:00 p.m. ✓
- (C) Tuesday at 8:00 a.m.
- (D) Tuesday at 6:00 p.m.
Worked solution
Precipitation is most likely when the air temperature and dewpoint temperature are nearly equal, indicating saturated air; on this graph that occurs around Monday at 8:00 p.m.
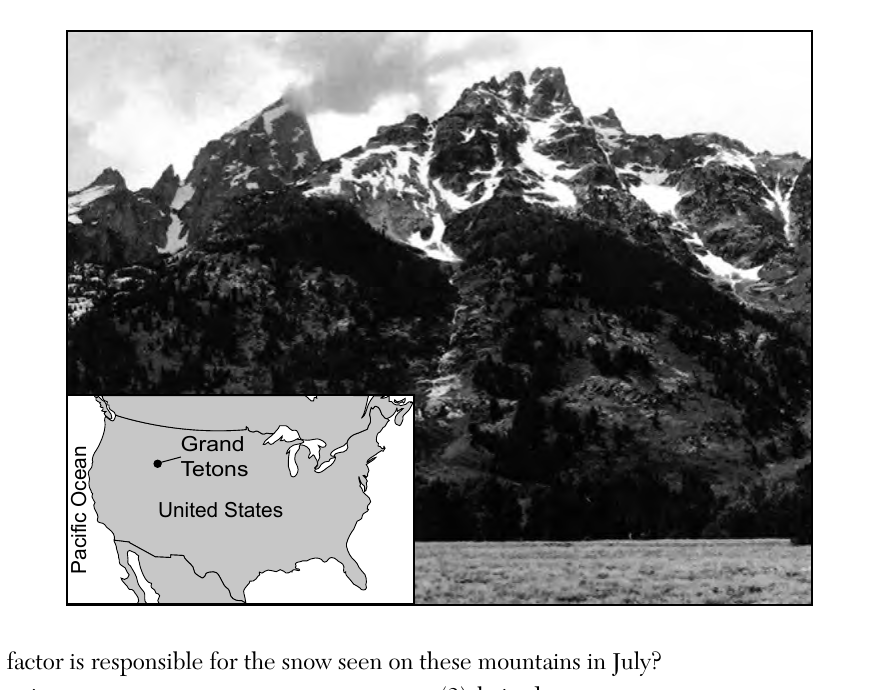
The photograph below shows a portion of the Grand Teton Mountains on a mid-July day. The inset map of the United States shows the location of the Grand Tetons. Which factor is responsible for the snow seen on these mountains in July?
- (A) elevation ✓
- (B) longitude
- (C) latitude
- (D) steep slopes
Worked solution
Temperature decreases with altitude, so even in mid-July the high elevation of the Grand Teton peaks keeps them cold enough to retain snow, while the valley below is snow-free.
Which percentage of the radioactive potassium-40 in a sample will have decayed in 2.6 × 10⁹ years?
- (A) 25%
- (B) 50%
- (C) 75% ✓
- (D) 100%
Worked solution
Potassium-40 has a half-life of 1.3 billion years, so 2.6 billion years represents exactly two half-lives, leaving 25% of the original undecayed and meaning 75% has decayed.
Based on Earth's geologic history, which group of organisms has existed for the shortest amount of time?
- (A) grasses
- (B) dinosaurs
- (C) birds
- (D) humans ✓
Worked solution
According to the geologic time scale, humans are the most recently evolved group listed, appearing only in the very latest part of the Cenozoic Era, so they have existed for the shortest amount of time.
Oxygen first became a major part of Earth's atmosphere from the
- (A) rifting in the Iapetus ocean
- (B) life processes of cyanobacteria in the ocean ✓
- (C) extensive coal-forming forests
- (D) breakdown of ozone by ultraviolet radiation
Worked solution
Early Precambrian atmosphere had little free oxygen; photosynthetic cyanobacteria in the oceans released oxygen as a byproduct, gradually building up atmospheric O2 (the Great Oxidation Event).
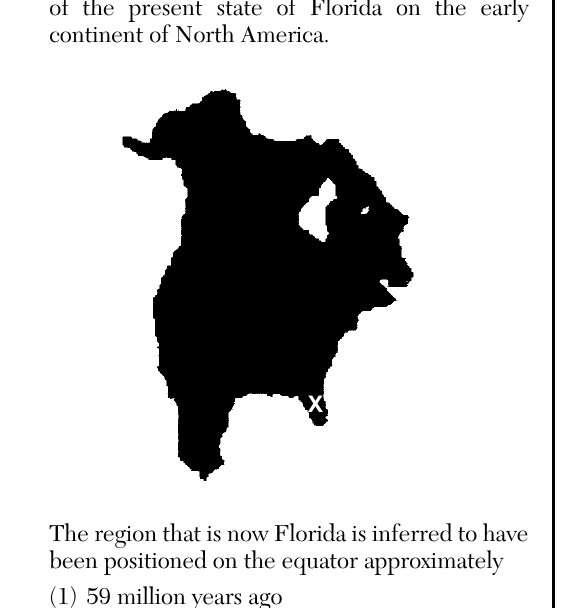
The letter X on the map below shows the location of the present state of Florida on the early continent of North America. The region that is now Florida is inferred to have been positioned on the equator approximately
- (A) 59 million years ago
- (B) 119 million years ago
- (C) 232 million years ago ✓
- (D) 458 million years ago
Worked solution
Using the Earth Science Reference Tables chart of inferred continental positions, the plate fragment that is now Florida sat on the equator around 232 million years ago, during the time of Pangea.
The division of geologic time into eras, periods, and epochs is based upon the
- (A) appearance and extinction of life forms ✓
- (B) occurrences of widespread volcanic eruptions
- (C) reversals in Earth's magnetic field
- (D) major mountain-building events
Worked solution
The geologic time scale's boundaries between eras, periods, and epochs were originally defined by major changes in the fossil record, such as mass extinctions and the appearance of new dominant life forms.
The first P-wave from an earthquake was recorded at 10:20:00 a.m. at a seismic station located 2200 km from the earthquake epicenter. At what time did the S-wave arrive?
- (A) 10:12:00 a.m.
- (B) 10:16:30 a.m.
- (C) 10:23:30 a.m. ✓
- (D) 10:27:50 a.m.
Worked solution
Using the Earthquake P-wave and S-wave Travel Time graph at a distance of 2200 km, the difference between S-wave and P-wave arrival times (the S-P interval) is about 3 minutes 30 seconds, giving an S-wave arrival of 10:23:30 a.m.
Which two hot spots are located at plate boundaries?
- (A) Iceland and Yellowstone
- (B) Tasman and St. Helena
- (C) Canary Island and Galapagos
- (D) Easter Island and Bouvet ✓
Worked solution
Easter Island lies directly on the East Pacific Rise and Bouvet Island lies on the Mid-Atlantic Ridge, both divergent plate boundaries, unlike the other listed hot spots which occur in the interior of plates.
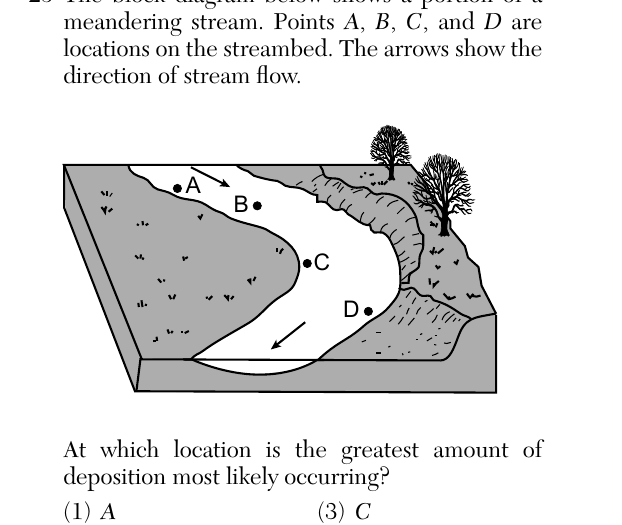
The block diagram below shows a portion of a meandering stream. Points A, B, C, and D are locations on the streambed. The arrows show the direction of stream flow. At which location is the greatest amount of deposition most likely occurring?
- (A) A
- (B) B
- (C) C ✓
- (D) D
Worked solution
On the inside of a meander bend the water moves slower, so it loses carrying capacity and drops its sediment load, building up a point bar; point C sits on this inside-bend point bar.
Instruments that record seismic waves on Mars allow scientists to infer the
- (A) gravitational forces between Mars and its two moons
- (B) percentage of minerals in the crust of Mars
- (C) availability of surface water on Mars
- (D) internal structure of Mars ✓
Worked solution
Just as on Earth, the way seismic waves travel, bend, and are blocked as they pass through a planet reveals the sizes and states of its internal layers, so seismometers on Mars let scientists infer its internal structure.
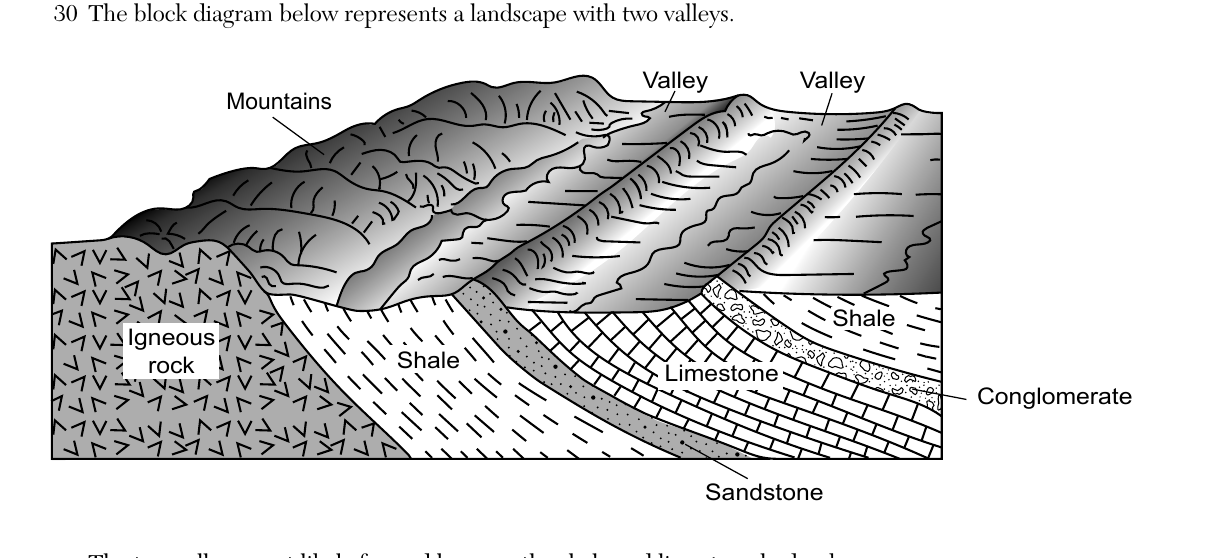
The block diagram below represents a landscape with two valleys. The two valleys most likely formed because the shale and limestone bedrock
- (A) are less resistant to weathering than the igneous, sandstone, and conglomerate bedrock ✓
- (B) are more resistant to weathering than the igneous, sandstone, and conglomerate bedrock
- (C) have undergone shorter periods of weathering than the igneous, sandstone, and conglomerate bedrock
- (D) have undergone longer periods of weathering than the igneous, sandstone, and conglomerate bedrock
Worked solution
Valleys form where weaker, less resistant rock (shale, limestone) is worn away faster than the surrounding more resistant rock types, leaving the resistant rock standing as higher mountains and ridges.
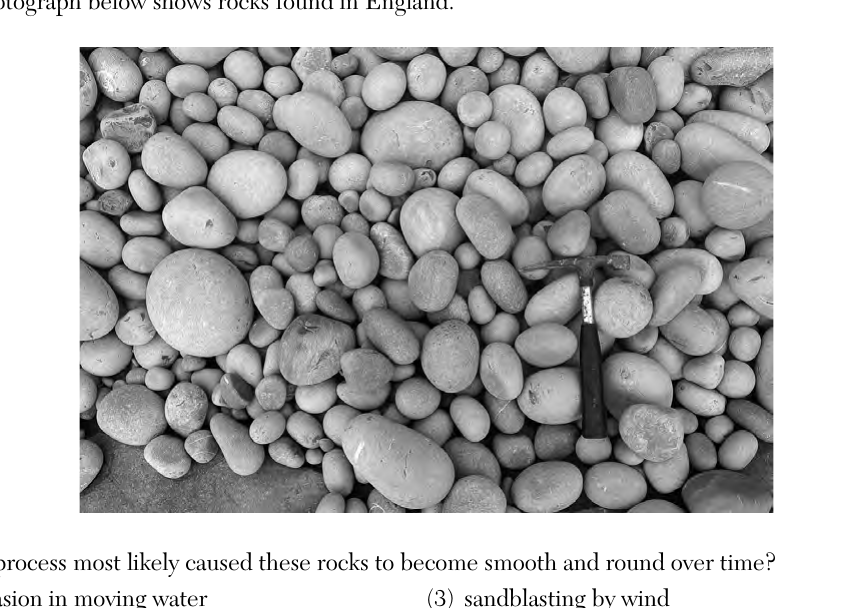
The photograph below shows rocks found in England. Which process most likely caused these rocks to become smooth and round over time?
- (A) abrasion in moving water ✓
- (B) dragging by a glacier
- (C) sandblasting by wind
- (D) downward movement by gravity
Worked solution
The rounded, smooth, well-sorted pebbles shown are typical of stream or beach cobbles that have been continually tumbled and abraded against one another by moving water.
The photograph below shows a volcanic mountain. Which map best shows the most likely complete stream drainage pattern near the summit (top) of this mountain at the time of this photograph?
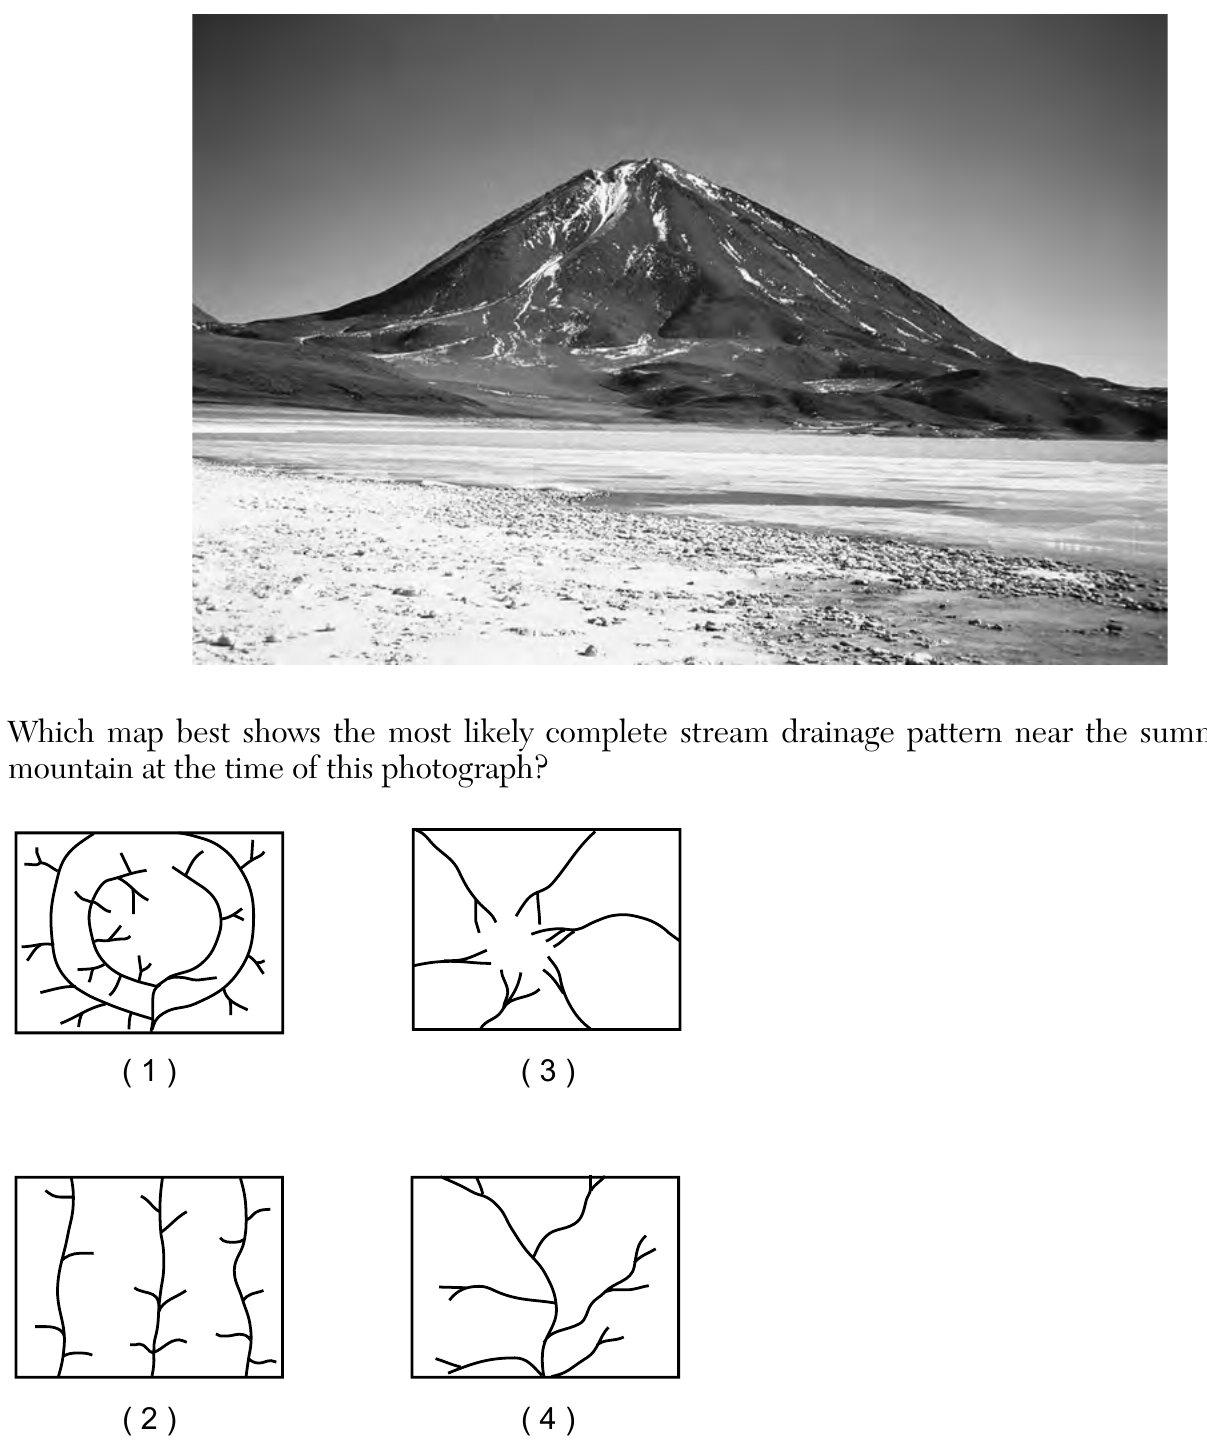
- (A) Map (1): concentric circular contour-like rings with short branching streams radiating from them
- (B) Map (2): a set of parallel straight streams running the same direction
- (C) Map (3): several streams radiating outward from a central summit point in different directions ✓
- (D) Map (4): a single dendritic (tree-branching) stream pattern flowing in one general direction
Worked solution
A volcanic cone slopes away from its summit in every direction, so streams draining the peak flow outward from the central high point like spokes, producing a radial drainage pattern.
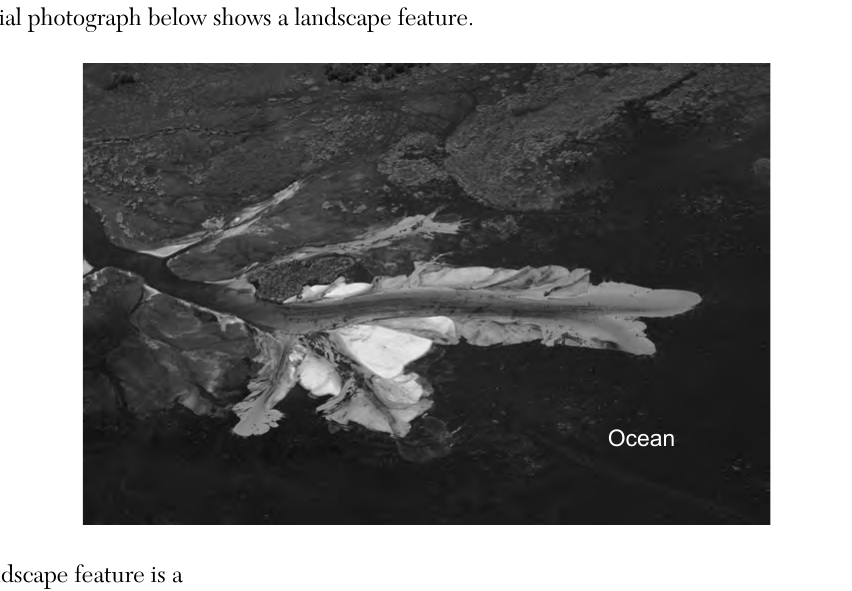
The aerial photograph below shows a landscape feature. This landscape feature is a
- (A) landslide formed by mass movement
- (B) landslide formed by stream deposition
- (C) delta formed by mass movement
- (D) delta formed by stream deposition ✓
Worked solution
The fan-shaped, light-colored sediment deposit at the mouth of a stream entering the ocean is a delta, formed when the stream slows abruptly and deposits its sediment load.
What is the name and texture of a sedimentary rock composed of carbon?
- (A) shale with a clastic texture
- (B) shale with a bioclastic texture
- (C) bituminous coal with a clastic texture
- (D) bituminous coal with a bioclastic texture ✓
Worked solution
According to the Earth Science Reference Tables, the sedimentary rock composed of carbon is bituminous coal, and because it forms from compacted organic (plant) material, its texture is classified as bioclastic.
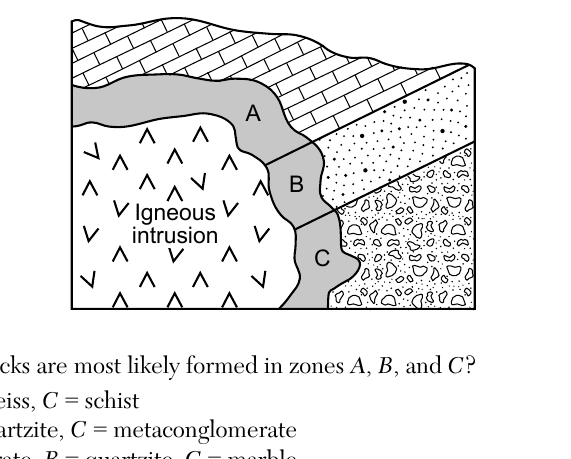
The cross section below represents an igneous intrusion into sedimentary bedrock layers. Letters A, B, and C identify different rocks within the shaded zone of contact metamorphism. Which metamorphic rocks are most likely formed in zones A, B, and C?
- (A) A = marble, B = gneiss, C = schist
- (B) A = marble, B = quartzite, C = metaconglomerate ✓
- (C) A = metaconglomerate, B = quartzite, C = marble
- (D) A = metaconglomerate, B = schist, C = gneiss
Worked solution
In the zone of contact metamorphism surrounding the intrusion, the original sedimentary rocks recrystallize without melting: the limestone layer (A) becomes marble, the sandstone layer (B) becomes quartzite, and the conglomerate layer (C, shown with its rounded pebble texture preserved) becomes metaconglomerate.
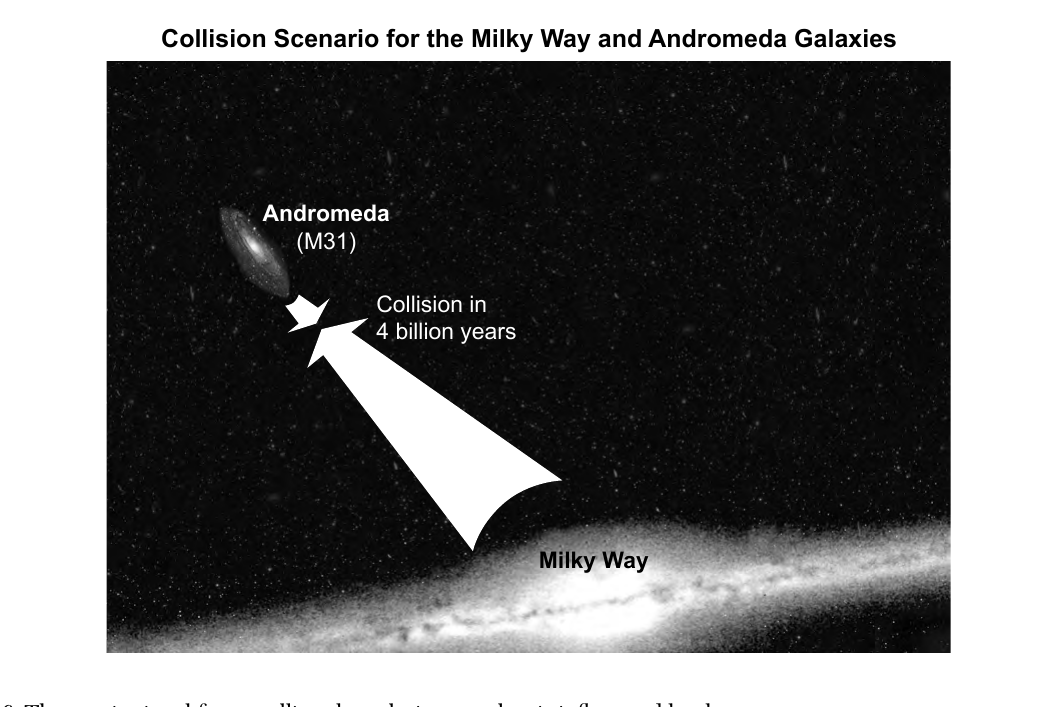
Base your answers to questions 36 and 37 on the diagram below and on your knowledge of Earth science. The diagram represents the predicted collision between the Milky Way and its sister galaxy, Andromeda. The collision is predicted to begin in about four billion years. It will take an additional two billion years to completely merge these two galaxies into one galaxy. The gravitational force pulling the galaxies together is influenced by the
- (A) mass of the stars and amount of cosmic background radiation
- (B) mass of all the stars and the distance between the two galaxies ✓
- (C) ages of the stars and amount of cosmic background radiation
- (D) ages of the stars and the distance between the two galaxies
Worked solution
Newton's law of gravitation shows that gravitational attraction depends only on the masses of the objects involved and the distance separating them, not on stellar age or background radiation.
The Andromeda Galaxy has a shape that is similar to the Milky Way Galaxy. The shape of the Andromeda Galaxy is best described as
- (A) elliptical and is the only other galaxy in the universe
- (B) elliptical and is one of the billions of other galaxies in the universe
- (C) spiral and is the only other galaxy in the universe
- (D) spiral and is one of billions of other galaxies in the universe ✓
Worked solution
Andromeda, like the Milky Way, is a spiral galaxy, and it is just one among the estimated hundreds of billions of galaxies that make up the observable universe.
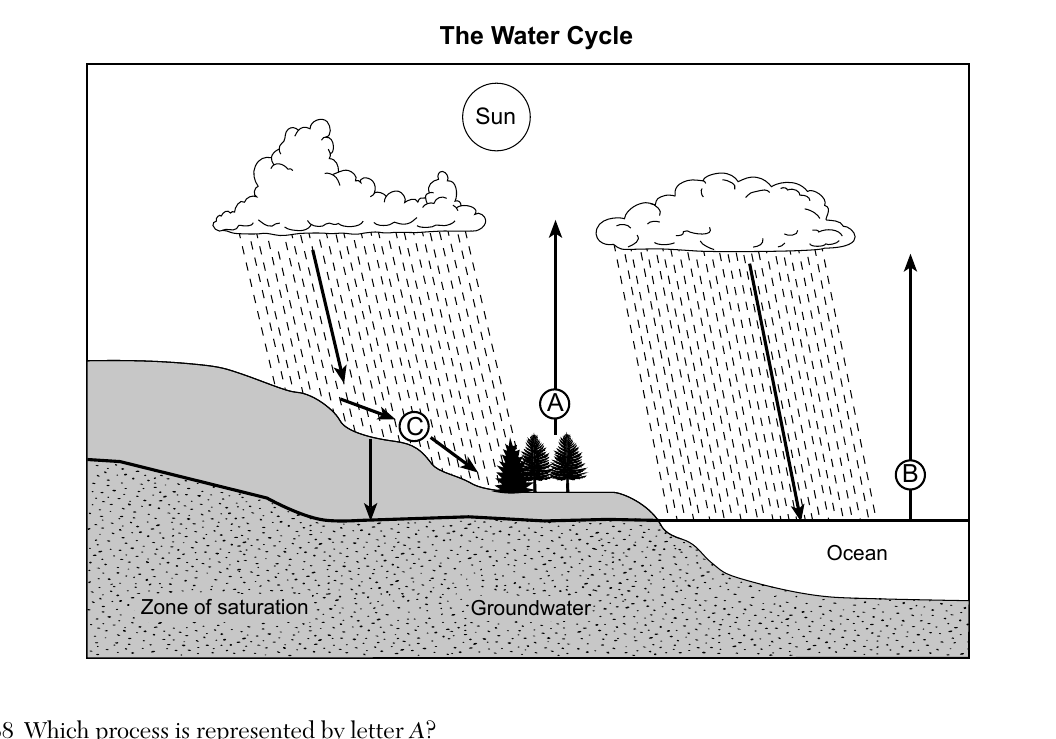
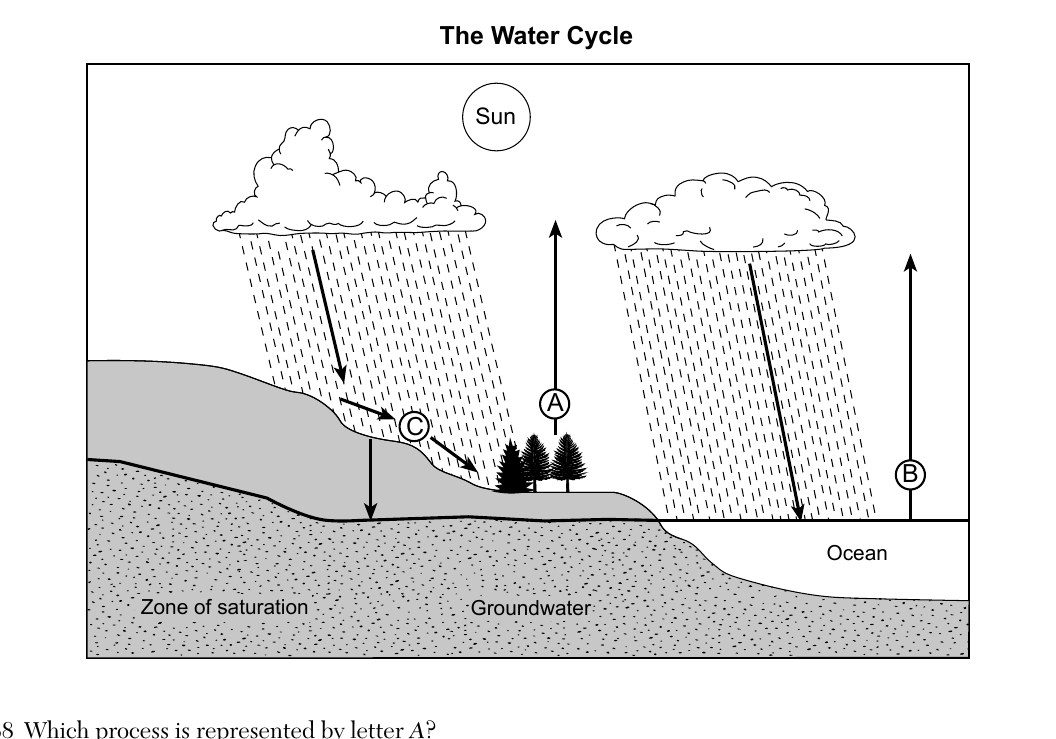
Base your answers to questions 38 through 40 on the diagram below and on your knowledge of Earth science. The diagram represents the water cycle. Letters A through C identify some processes. Arrows represent the movement of water. Which process is represented by letter A?
- (A) transpiration ✓
- (B) capillarity
- (C) infiltration
- (D) precipitation
Worked solution
Letter A shows an upward arrow originating from the trees, representing transpiration, the release of water vapor from plant leaves into the atmosphere.
Which process and heat-energy exchange are represented by letter B?
- (A) condensation; gain of 334 J/g
- (B) condensation; release of 2260 J/g
- (C) evaporation; gain of 2260 J/g ✓
- (D) evaporation; release of 334 J/g
Worked solution
Letter B shows water moving upward from the ocean into the atmosphere, which is evaporation; this phase change requires water to absorb (gain) 2260 J/g, the heat of vaporization listed in the Reference Tables.
Which conditions would cause runoff at location C to decrease?
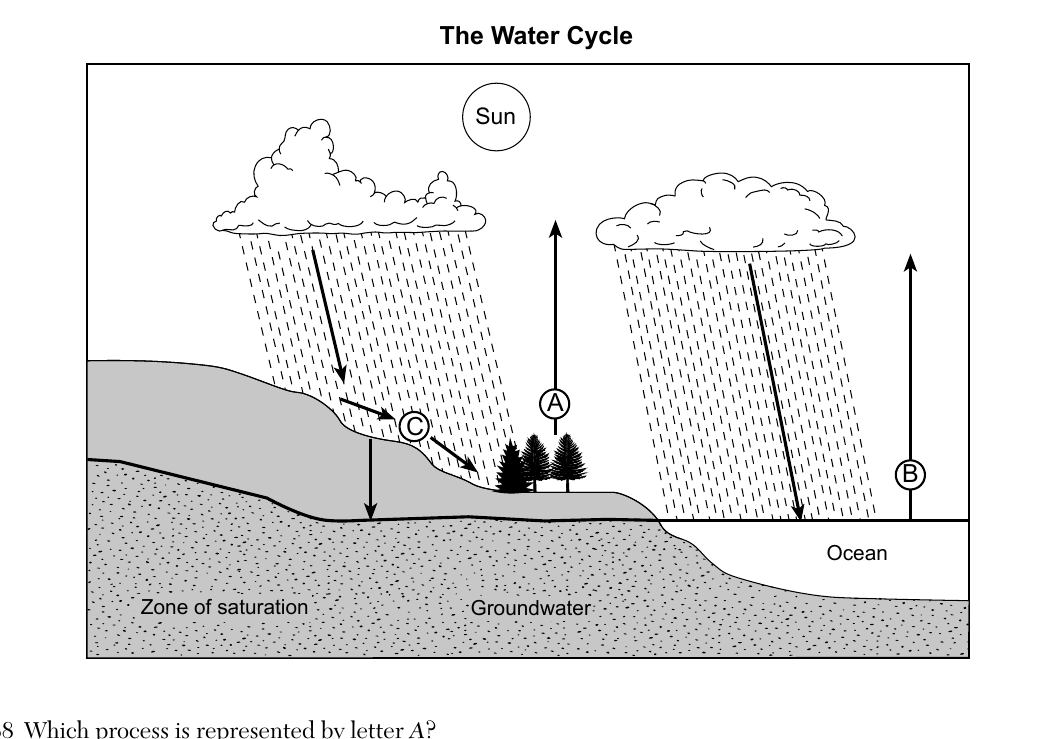
- (A) decreased precipitation and decreased slope ✓
- (B) decreased precipitation and increased slope
- (C) increased precipitation and decreased slope
- (D) increased precipitation and increased slope
Worked solution
Runoff is reduced when there is less rainfall available to run off and when a gentler slope gives water more time to soak into the ground (infiltrate) instead of flowing overland, so both decreased precipitation and decreased slope reduce runoff at C.
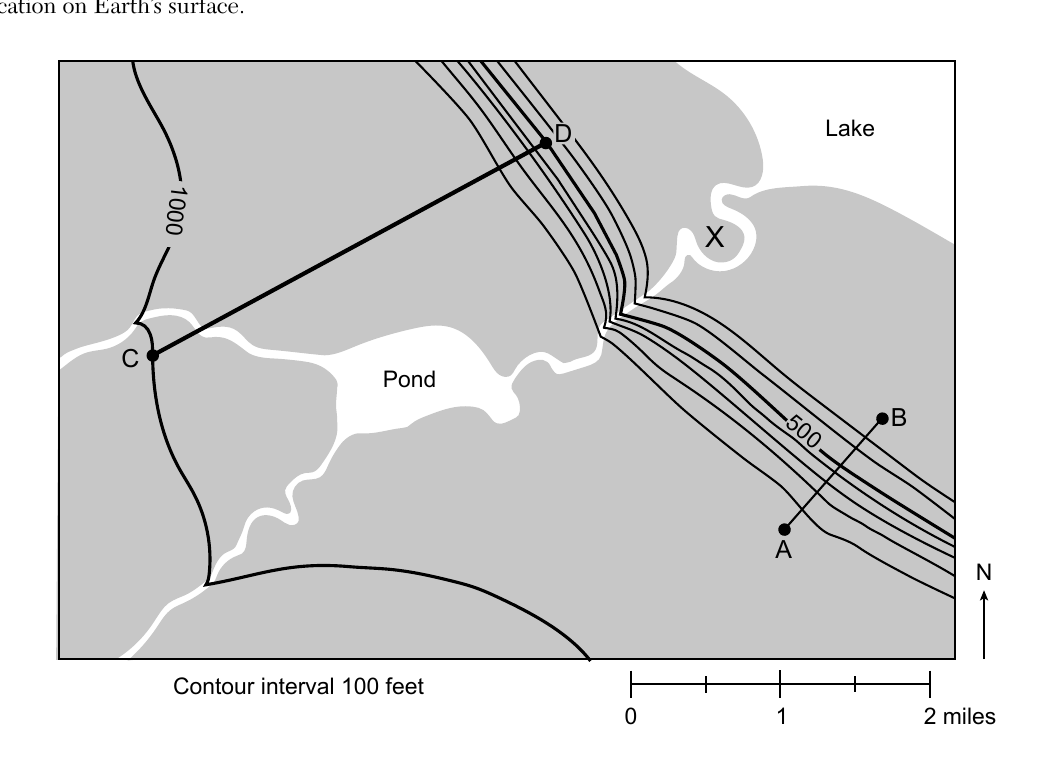
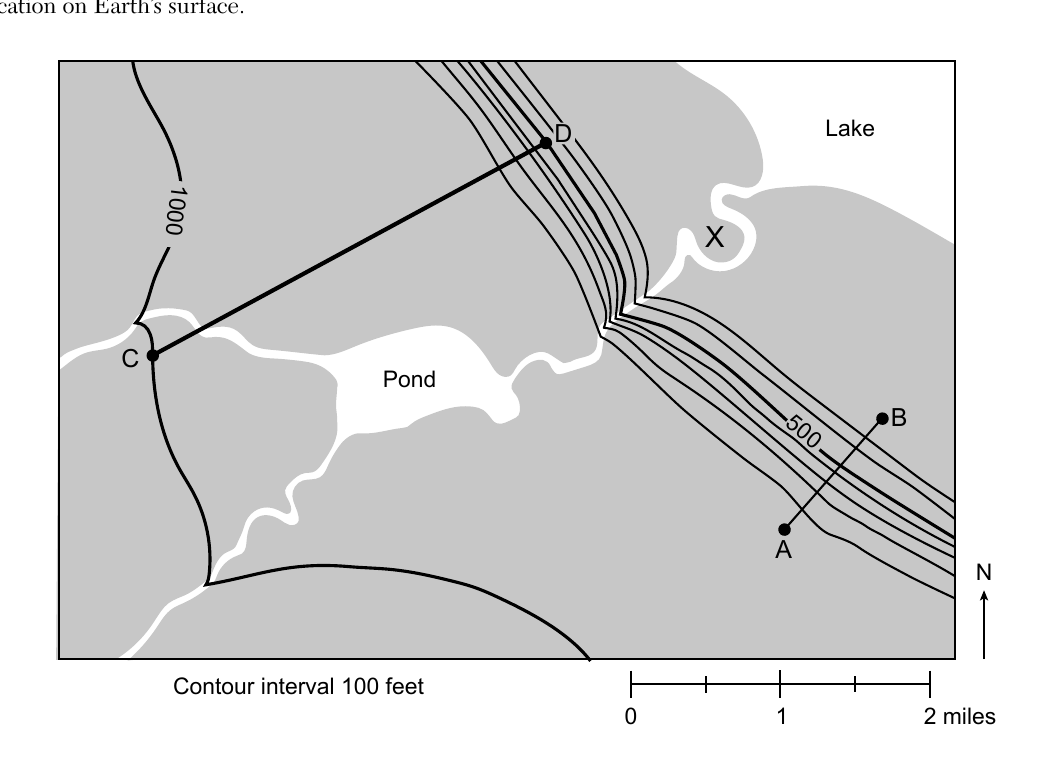
Base your answers to questions 41 through 44 on the topographic map below and on your knowledge of Earth science. Lines AB and CD are reference lines on the map. Elevations are shown in feet. Letter X represents a location on Earth's surface. The map shows a Lake, a Pond, contour lines including one marked 1000 and one marked 500, points A and B near the closely spaced 500-ft contours, and points C and D connected by a straight reference line, with contour interval 100 feet and a scale bar from 0 to 2 miles. Which profile represents the most likely shape of the land between locations A and B?
- (A) V-shaped dip, low in the middle between A and B
- (B) smooth curve rising steadily from low at A to high at B
- (C) line declining steadily from higher elevation at A down to lower ground at B ✓
- (D) rounded hill shape, high in the middle between A and B
Worked solution
Points A and B lie on a steadily sloping hillside where the contour lines run roughly parallel between them, with elevation decreasing from A down toward B near the lake, matching a steadily declining profile rather than a valley or hill shape.
What is the approximate gradient, in feet per mile (ft/mi), from point C to point D on the map?
- (A) 133 ft/mi
- (B) 167 ft/mi ✓
- (C) 250 ft/mi
- (D) 500 ft/mi
Worked solution
Measuring the straight-line distance between C and D with the map's scale bar (about 3 miles) and reading the elevation change between the contour lines the CD line crosses (about 500 feet) gives a gradient of roughly 167 ft/mi.
Letter X is located on which landscape feature?
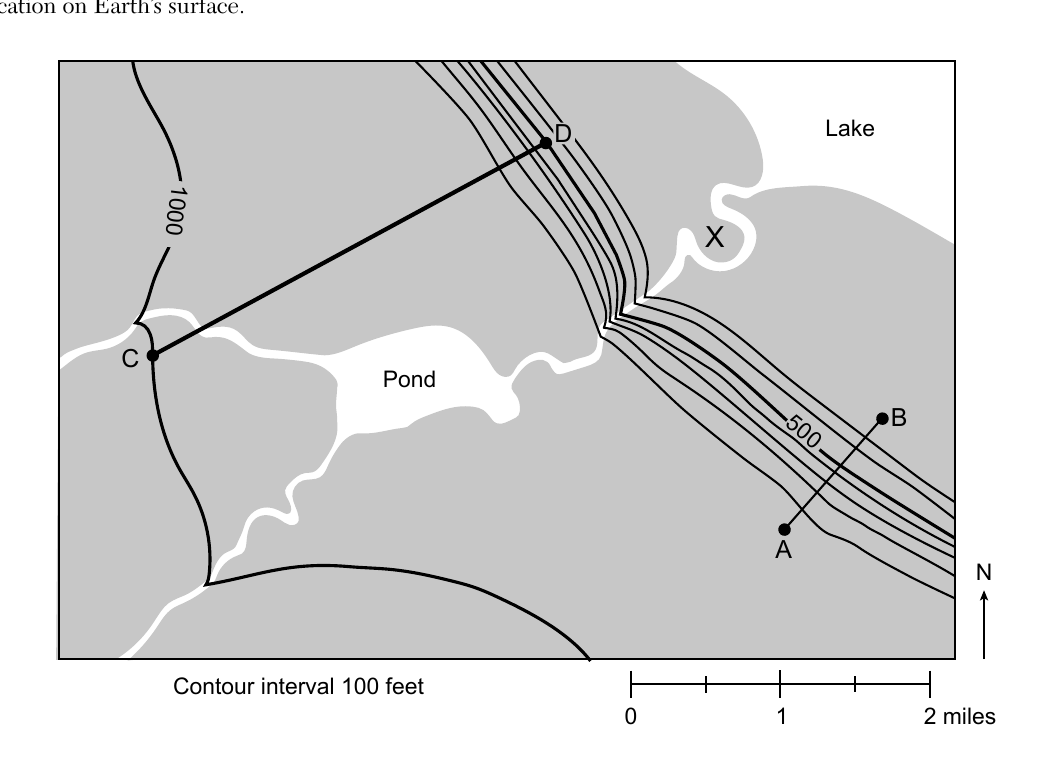
- (A) sandbar
- (B) sand dune
- (C) escarpment
- (D) flood plain ✓
Worked solution
Letter X lies on the flat, low ground adjacent to the stream near where it enters the lake, the type of level land that is periodically covered by floodwaters, which defines a flood plain.
The arrows on which map best represent the direction of stream flow relative to the pond?
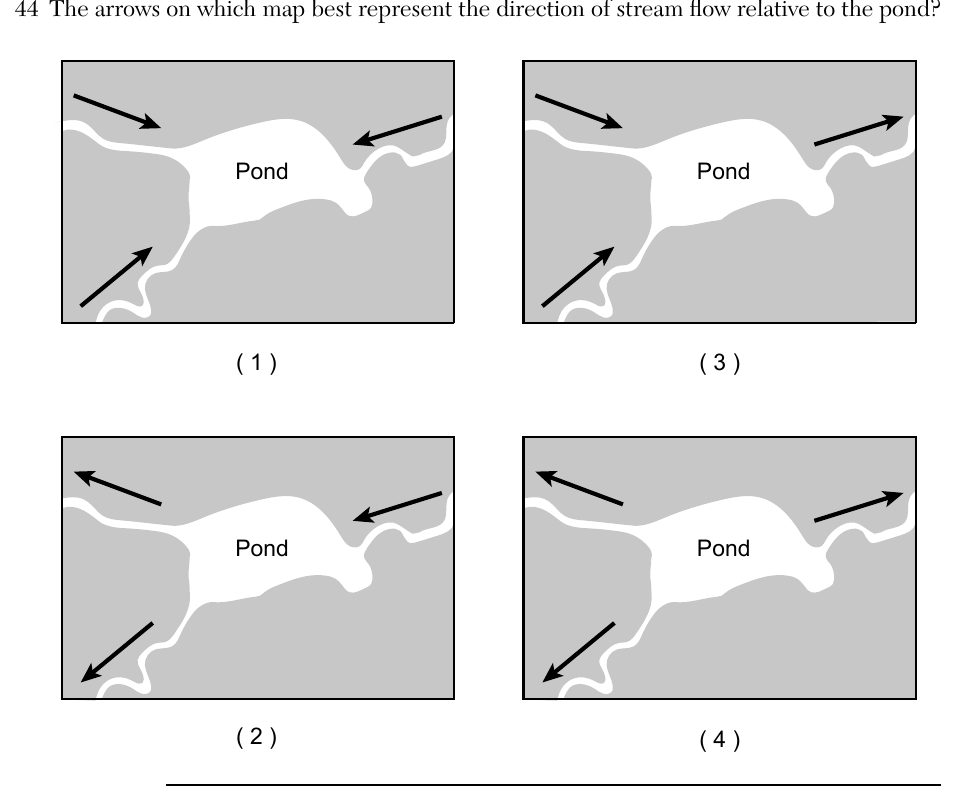
- (A) arrows all pointing outward from the pond (map 1)
- (B) arrows all pointing outward from the pond, mirrored (map 2)
- (C) arrows all pointing inward toward the pond from the tributaries (map 3) ✓
- (D) arrows in mixed directions relative to the pond (map 4)
Worked solution
The V-shaped bends in the contour lines around the tributary streams point upstream (uphill, away from the pond), which means the streams themselves flow downhill and drain into the pond, matching the map with arrows converging inward toward the pond.
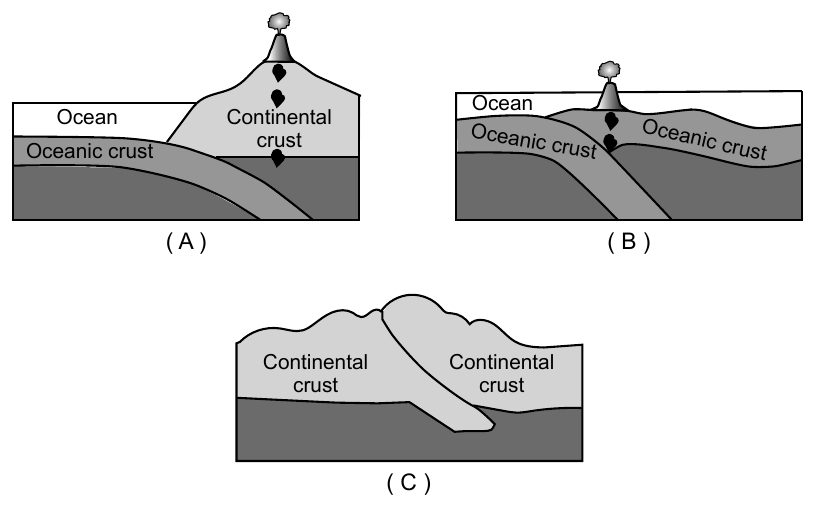
Base your answers to questions 45 through 47 on the cross sections below and on your knowledge of Earth science. The cross sections represent three plate boundaries labeled A, B, and C. 45 Compared to the density and thickness of the continental crust in diagram A, the oceanic crust is
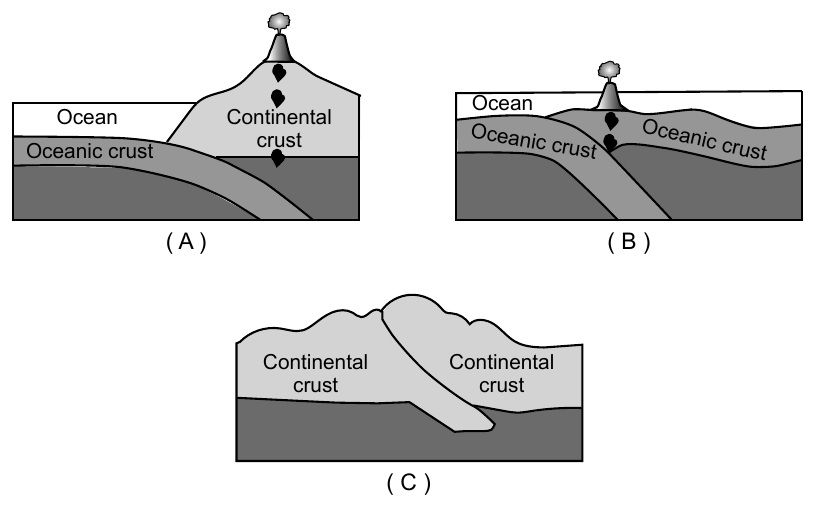
- (A) less dense and thinner
- (B) less dense and thicker
- (C) more dense and thinner ✓
- (D) more dense and thicker
Worked solution
Oceanic crust is basaltic, which is denser than the granitic continental crust, but oceanic crust is much thinner than continental crust.
Base your answers to questions 45 through 47 on the cross sections below and on your knowledge of Earth science. The cross sections represent three plate boundaries labeled A, B, and C. 46 Which diagram best represents the relative motion of the oceanic crust at plate boundary B?
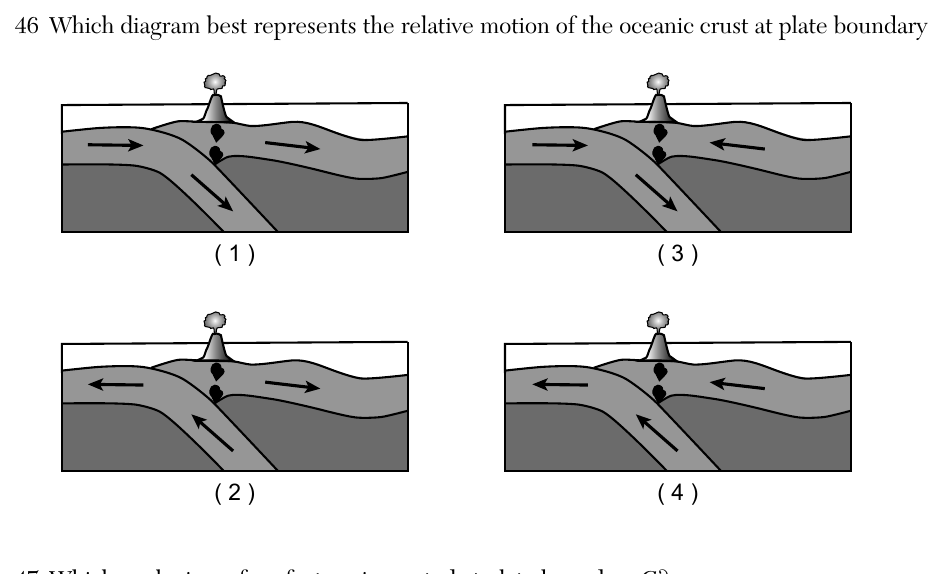
- (A) Diagram (1): both surface arrows point in the same direction (to the right), with the subducting slab arrow angled downward
- (B) Diagram (2): surface arrows point away from each other (diverging), with the subducting slab arrow angled upward
- (C) Diagram (3): surface arrows point toward the center (converging) with the subducting slab arrow angled to match plate boundary B's geometry ✓
- (D) Diagram (4): both surface arrows point in the same lateral direction, indicating transform-like motion
Worked solution
Plate boundary B is an oceanic-oceanic convergent (subduction) boundary, so the correct diagram must show both oceanic plates moving toward each other with one plate diving beneath the other along the same dip direction shown in the original cross section.
Base your answers to questions 45 through 47 on the cross sections below and on your knowledge of Earth science. The cross sections represent three plate boundaries labeled A, B, and C. 47 Which geologic surface feature is created at plate boundary C?
- (A) ocean trench
- (B) rift valley
- (C) volcanic mountain
- (D) folded mountain ✓
Worked solution
Plate boundary C shows two continental plates colliding; since neither can subduct (both are low density), the crust crumples and folds upward into folded mountains.
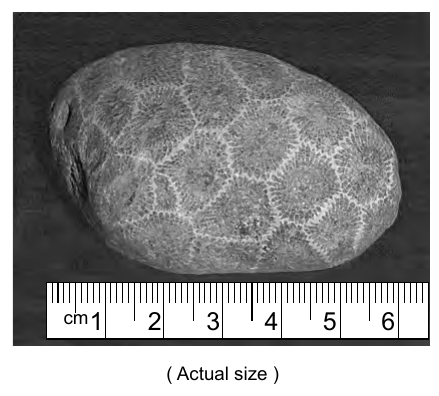
Base your answers to questions 48 through 50 on the passage and photograph below and on your knowledge of Earth science. The photograph shows a typical Petoskey stone. Petoskey Stones Petoskey stones are famous rock specimens found on beaches all around Lake Michigan, but especially on beaches near the city of Petoskey, Michigan. The stones are actually well-eroded pieces of coral reefs that were alive between 375 and 400 million years ago. At the time the coral animals were living and forming the reefs, the area was underwater and the coral, along with many other reef animals, thrived. Eventually, the ocean disappeared and the fossil reefs were uncovered. Advancing and retreating glaciers broke pieces off the fossil reefs, smoothed their edges, and distributed them throughout the area. Lake Michigan, along with the other Great Lakes, formed at the end of the Ice Age. Today, lake waves continue to distribute a seemingly endless supply of Petoskey stones, with their unique coral fossils, to the beaches around Lake Michigan. 48 The coral that eventually became Petoskey stones were alive during which geologic time period?
- (A) Permian
- (B) Devonian ✓
- (C) Silurian
- (D) Ordovician
Worked solution
The 375-400 million year age given for the coral falls within the Devonian Period on the geologic time scale.
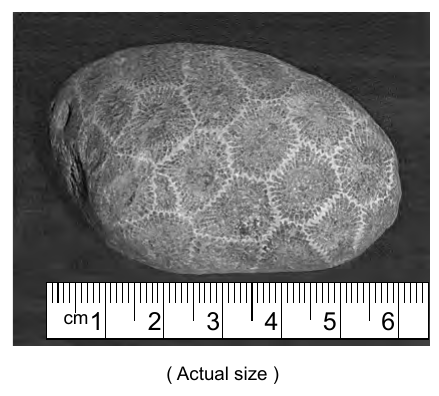
Base your answers to questions 48 through 50 on the passage and photograph below and on your knowledge of Earth science. The photograph shows a typical Petoskey stone. 49 Which New York State index fossil is in the same group of organisms as the Petoskey stone coral?
- (A) Lichenaria ✓
- (B) Platyceras
- (C) Bothriolepis
- (D) Cooksonia
Worked solution
Of the listed NYS index fossils, only Lichenaria is a coral, placing it in the same organism group as the coral that formed the Petoskey stone.
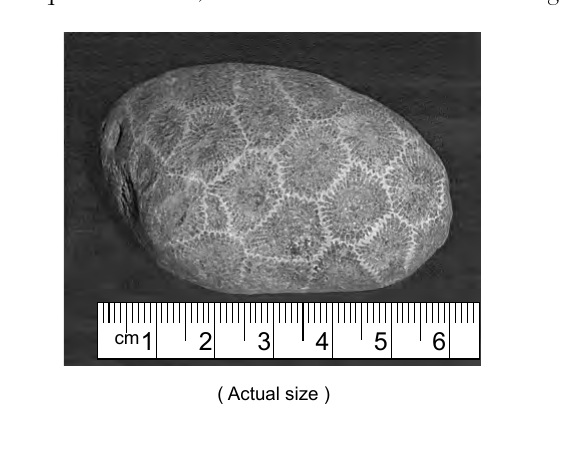
Base your answers to questions 48 through 50 on the passage and photograph below and on your knowledge of Earth science. The photograph shows a typical Petoskey stone, with a centimeter ruler (marked 1-6 cm) shown beside the stone for scale, labeled "(Actual size)". 50 The Petoskey stone shown in the photograph is classified as a
- (A) sand
- (B) pebble ✓
- (C) cobble
- (D) boulder
Worked solution
Measured against the printed centimeter scale, the rounded stone is a few centimeters across, which falls in the pebble range on the ESRT sediment size scale (larger than sand, smaller than cobble).
Base your answers to questions 51 through 54 on the weather map in your answer booklet and on your knowledge of Earth science. The weather map shows air pressures in millibars (mb) at locations on and around the Florida Peninsula during Hurricane Wilma. Five isobars are shown. 51 On the map in your answer booklet, draw the 1000 mb and 1004 mb isobars. Extend the isobars to the edges of the map.
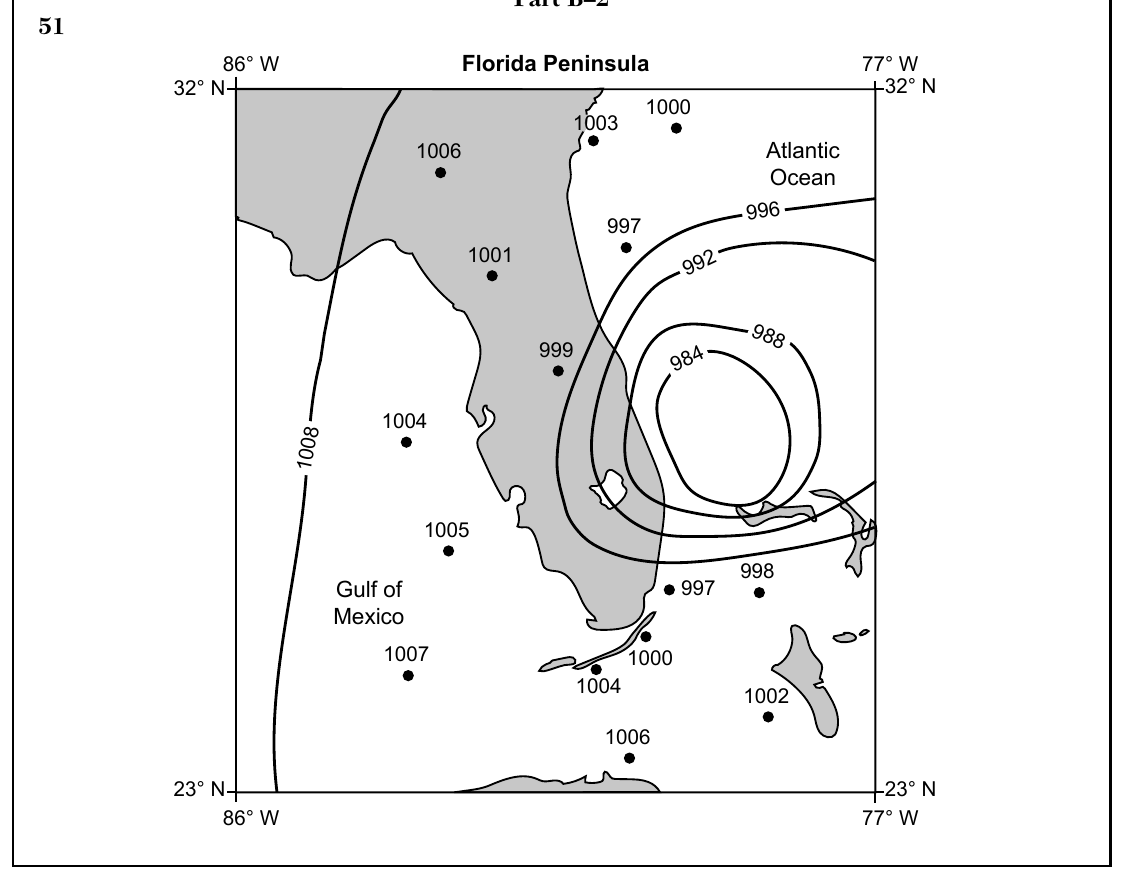
Worked solution
Isobars are lines of equal air pressure; for a hurricane, pressure decreases toward the center, so the 1000 mb and 1004 mb lines must be drawn inside (surrounded by) the higher-value isobars already shown, following the same smooth, roughly circular/elliptical pattern.
Base your answers to questions 51 through 54 on the weather map in your answer booklet and on your knowledge of Earth science. The weather map shows air pressures in millibars (mb) at locations on and around the Florida Peninsula during Hurricane Wilma. Five isobars are shown. 52 Convert the air pressure of the lowest value isobar shown on the map from millibars to inches of mercury.
On the completed weather map, the lowest value isobar shown is the 1000 mb isobar (the isobars decrease inward toward the hurricane center: 1016, 1012, 1008, 1004, 1000 mb). Use the Pressure conversion scale in the Earth Science Reference Tables, which pairs millibars with inches of mercury: | Millibars (mb) | Inches of mercury (in) | | --- | --- | | 1013.2 (one atmosphere) | 29.92 | | 1000.0 | 29.53 |
Worked solution
The lowest isobar on the completed map is 1000 mb; converting millibars to inches of mercury using the standard conversion factor gives approximately 29.53 in Hg.
Base your answers to questions 51 through 54 on the weather map in your answer booklet and on your knowledge of Earth science. The weather map shows air pressures in millibars (mb) at locations on and around the Florida Peninsula during Hurricane Wilma. Five isobars are shown. 53 Identify the weather instrument used to measure air pressure.
Worked solution
A barometer is the standard instrument used to measure atmospheric (air) pressure.
Base your answers to questions 51 through 54 on the weather map in your answer booklet and on your knowledge of Earth science. The weather map shows air pressures in millibars (mb) at locations on and around the Florida Peninsula during Hurricane Wilma. Five isobars are shown. 54 Write the two-letter weather map symbol for the type of air mass in which this hurricane formed.
Worked solution
Hurricanes develop over warm tropical ocean waters, which produce a maritime tropical (mT) air mass, warm and moist.
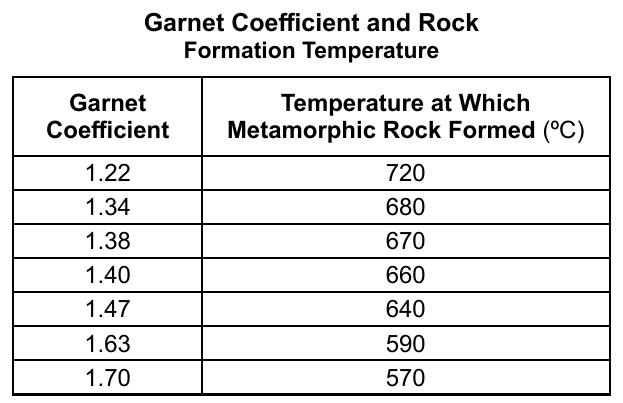
Base your answers to questions 55 through 57 on the passage and data table below and on your knowledge of Earth science. The data table shows garnet coefficients and rock formation temperatures. Using Garnet as a Geothermometer A geothermometer mineral is a mineral with slight differences in composition that can be used to estimate the temperature at which some types of metamorphic rock form. Garnet is a geothermometer mineral because there are several kinds of garnet that contain different amounts of iron and magnesium. The "garnet coefficient" indicates the ratio of iron to magnesium found in the garnet. When the garnet coefficient is high, there is a greater percentage of iron compared to magnesium. The garnet coefficient is an indicator of the temperature at which a metamorphic rock formed. Garnet Coefficient and Rock Formation Temperature | Garnet Coefficient | Temperature at Which Metamorphic Rock Formed (ºC) | | --- | --- | | 1.22 | 720 | | 1.34 | 680 | | 1.38 | 670 | | 1.40 | 660 | | 1.47 | 640 | | 1.63 | 590 | | 1.70 | 570 | 55 Determine the rock formation temperature for a rock sample with a garnet coefficient of 1.55.
Worked solution
Linear interpolation between the two nearest data points (1.47 → 640°C and 1.63 → 590°C) gives a formation temperature of about 615°C for a garnet coefficient of 1.55.
Base your answers to questions 55 through 57 on the passage and data table below and on your knowledge of Earth science. The data table shows garnet coefficients and rock formation temperatures. 56 Describe the rock formation temperatures that are indicated when higher garnet coefficients are found.
Worked solution
The data table shows an inverse relationship: rock samples with higher garnet coefficients formed at lower temperatures.
Base your answers to questions 55 through 57 on the passage and data table below and on your knowledge of Earth science. 57 Identify one foliated metamorphic rock for which the garnet coefficient might be used to determine the temperature at which the rock formed.
Worked solution
Garnet-bearing metamorphic rocks with visible foliation (banding/parallel mineral alignment) are typically schist or gneiss; schist is the most common garnet-bearing foliated rock.
Base your answers to questions 58 and 59 on the map and graph below and on your knowledge of Earth science. The map of Australia shows the locations of three cities: Brisbane, Melbourne, and Wagga Wagga. The graph shows the average monthly air temperatures in Wagga Wagga and Melbourne, in degrees Celsius (°C), with both curves peaking around January (near 20-24°C) and reaching their lowest point around July (near 9-10°C). 58 Compared to the average monthly air temperature curve for Melbourne, describe how the average monthly air temperature curve is different for a city in New York State.
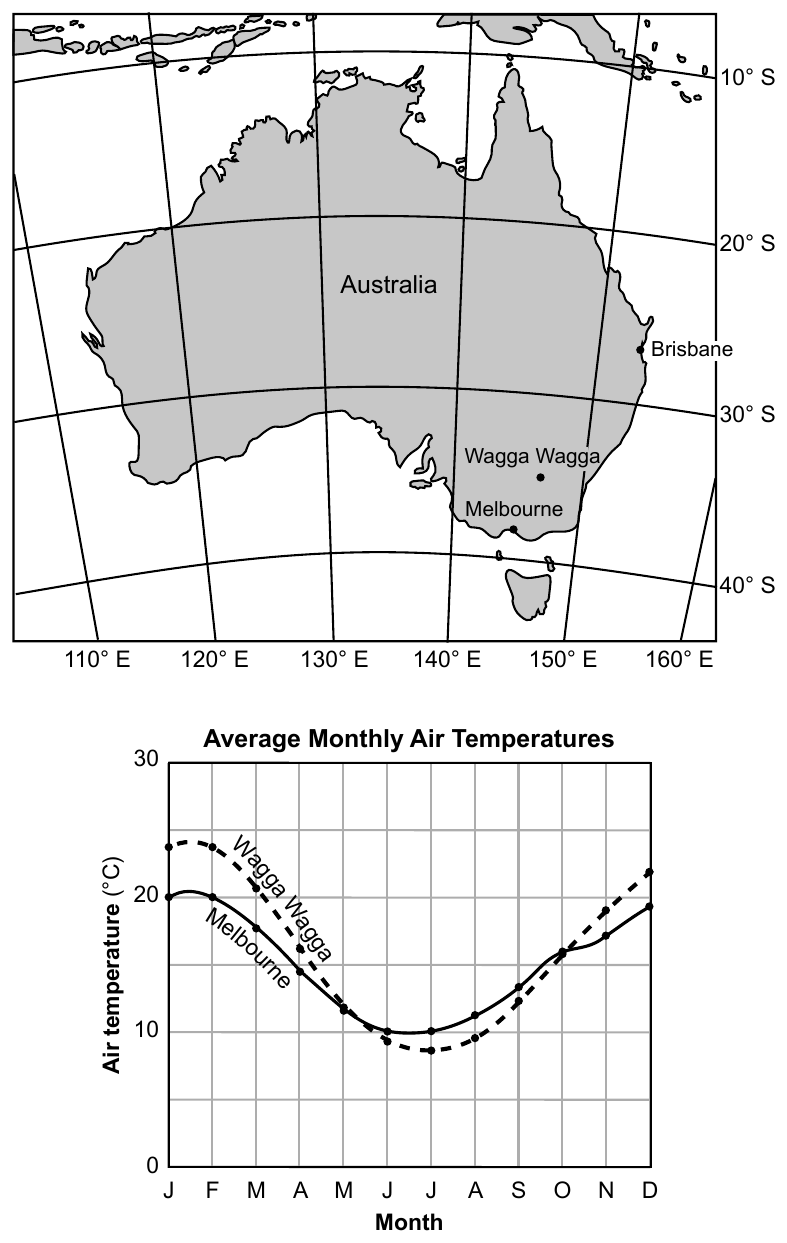
Worked solution
Because Melbourne is in the Southern Hemisphere and New York is in the Northern Hemisphere, their seasons (and therefore their monthly temperature curves) are six months out of phase with each other.
Base your answers to questions 58 and 59 on the map and graph below and on your knowledge of Earth science. The map of Australia shows the locations of three cities: Brisbane, Melbourne, and Wagga Wagga. 59 In your answer booklet, circle warm or cool to indicate the relative temperature of the ocean current that flows off the coast of Brisbane. State the name of this current.
Worked solution
The East Australian Current is a warm current that flows south along Australia's east coast, past Brisbane.
Base your answers to questions 60 through 62 on the cross sections below and on your knowledge of Earth science. The cross sections represent changes in the land at the Montauk Lighthouse between 1838 and 1988. The Montauk Lighthouse, built on unconsolidated sediments, is located on the easternmost tip of Long Island. The distance from the center of the lighthouse to the edge of the escarpment is indicated in each cross section: 220 feet in 1838 and 100 feet in 1988. 60 Identify one agent of erosion that removed the sediment and changed the position of the escarpment between 1838 and 1988.
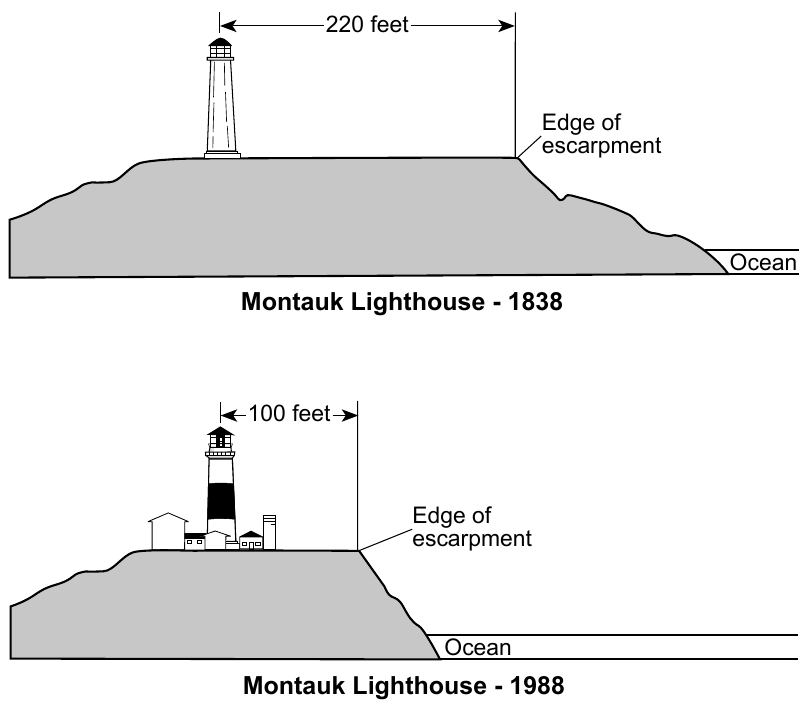
Worked solution
Breaking ocean waves are the main agent of erosion that undercuts and removes sediment from coastal escarpments like the one at Montauk.
Base your answers to questions 60 through 62 on the cross sections below and on your knowledge of Earth science. The distance from the center of the lighthouse to the edge of the escarpment was 220 feet in 1838 and 100 feet in 1988. 61 Calculate the rate of erosion, in feet per year, between the lighthouse and the edge of the escarpment that occurred between 1838 and 1988. Express your answer to the nearest tenth.
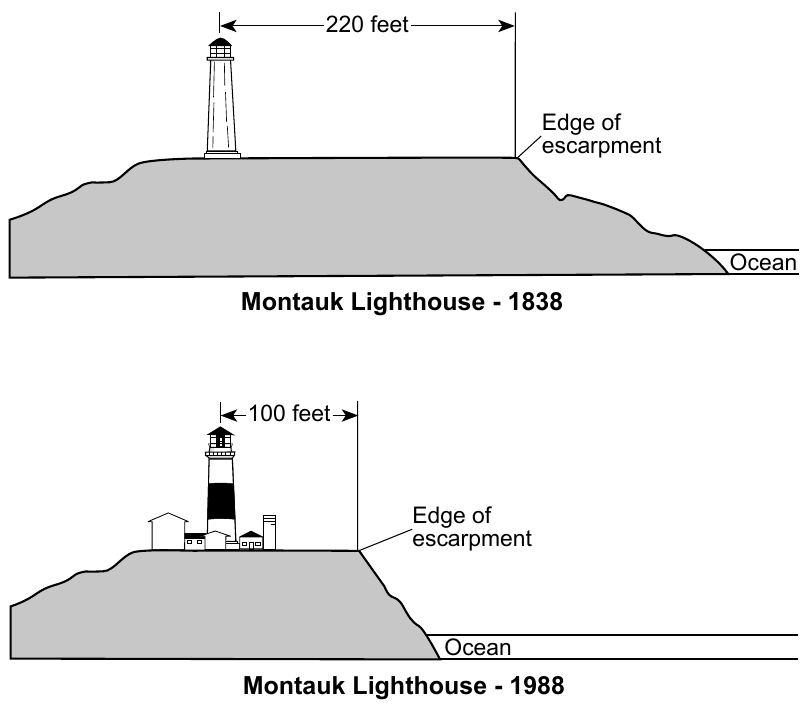
Worked solution
The escarpment retreated 120 feet closer to the lighthouse over 150 years, giving an average erosion rate of 0.8 feet per year.
Base your answers to questions 60 through 62 on the cross sections below and on your knowledge of Earth science. 62 Describe one action that could be taken to slow down or prevent the future erosion of the land between the escarpment and the ocean.
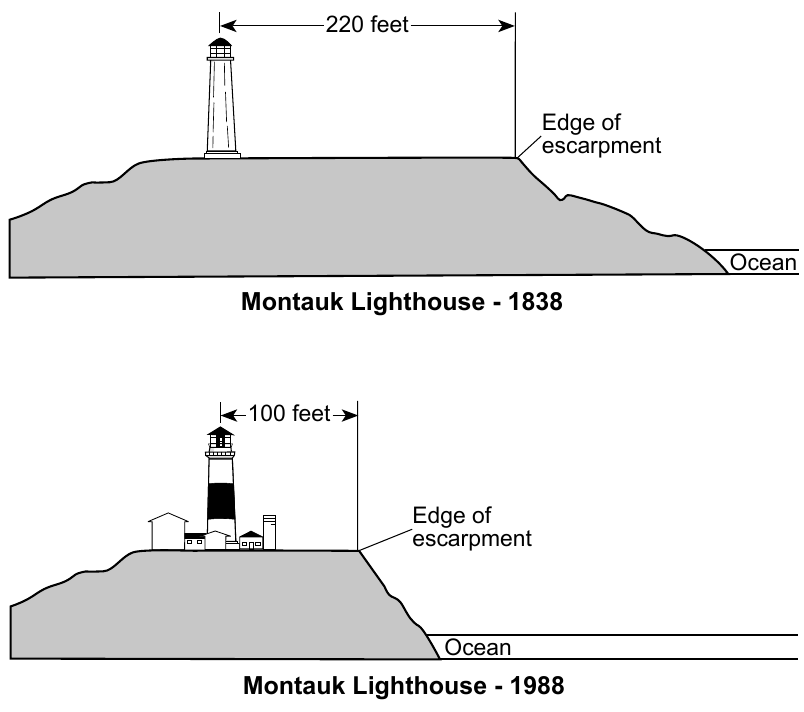
Worked solution
Coastal engineering structures such as seawalls or riprap, or stabilizing vegetation, reduce the wave energy that erodes the escarpment, slowing further land loss.
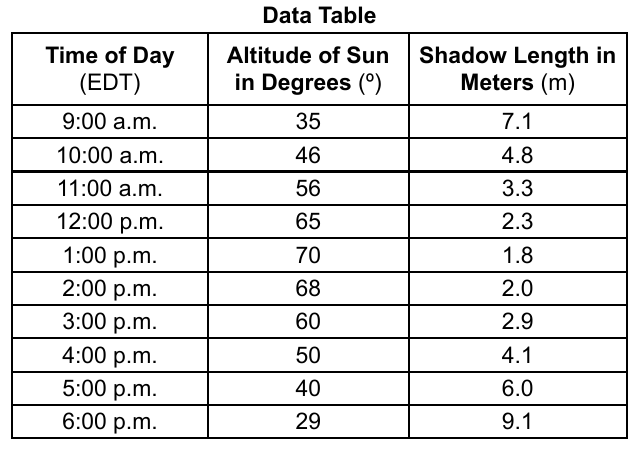
Base your answers to questions 63 through 65 on the data table below and on your knowledge of Earth science. The data table shows the Sun's altitude and the shadow length measured from the base of a five-meter-high pole on June 22 in Rochester, New York. During daylight savings time, clocks are set one hour ahead, so solar noon occurs at approximately 1:00 p.m. Data Table | Time of Day (EDT) | Altitude of Sun in Degrees (º) | Shadow Length in Meters (m) | | --- | --- | --- | | 9:00 a.m. | 35 | 7.1 | | 10:00 a.m. | 46 | 4.8 | | 11:00 a.m. | 56 | 3.3 | | 12:00 p.m. | 65 | 2.3 | | 1:00 p.m. | 70 | 1.8 | | 2:00 p.m. | 68 | 2.0 | | 3:00 p.m. | 60 | 2.9 | | 4:00 p.m. | 50 | 4.1 | | 5:00 p.m. | 40 | 6.0 | | 6:00 p.m. | 29 | 9.1 | 63 On the graph in your answer booklet, construct a line graph by plotting the altitude of the Sun for each time of day shown on the data table. Connect all ten plots with a line. The shadow-length data have already been plotted using the scale on the right.
Worked solution
Plotting altitude vs. time produces a bell-shaped (arch) curve peaking at solar noon (1:00 p.m., 70°), consistent with the Sun rising in altitude through the morning and declining in the afternoon.
Base your answers to questions 63 through 65 on the data table below and on your knowledge of Earth science. 64 Based on the data table, describe the relationship between the altitude of the Sun and the length of the shadow.
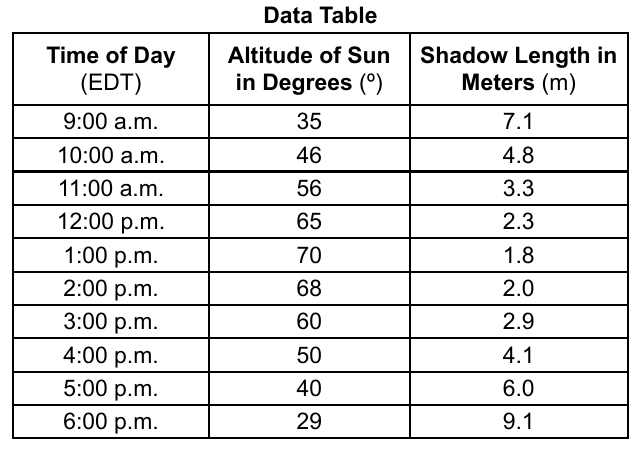
Worked solution
The data table shows an inverse relationship between Sun altitude and shadow length: higher Sun altitude produces shorter shadows, and lower Sun altitude produces longer shadows.
Base your answers to questions 63 through 65 on the data table below and on your knowledge of Earth science. 65 Based on the graph, determine the shadow length of the pole, in meters, at 4:30 p.m.
Worked solution
Interpolating halfway between the 4:00 p.m. (4.1 m) and 5:00 p.m. (6.0 m) shadow lengths gives an estimated shadow length of about 5.0 meters at 4:30 p.m.
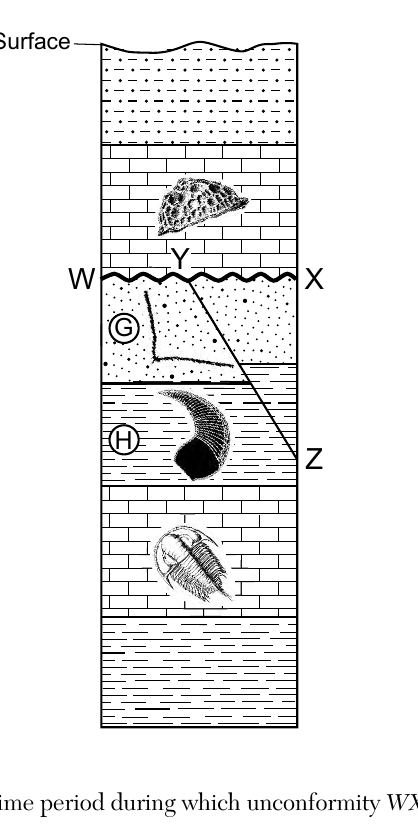
Base your answers to questions 66 and 67 on the cross section below and on your knowledge of Earth science. Letters G and H identify some rock layers. The wavy line WX indicates an unconformity, and line YZ indicates a fault. Index fossils are represented in some rock layers. Rock layers have not been overturned. 66 Identify the most likely geologic time period during which unconformity WX was forming.
Worked solution
The unconformity WX formed during the time period(s) missing from the rock record, that is, the interval between the top of layer G (below WX) and the layer directly above WX, as determined by comparing the index fossils in those layers on the ESRT geologic time scale.
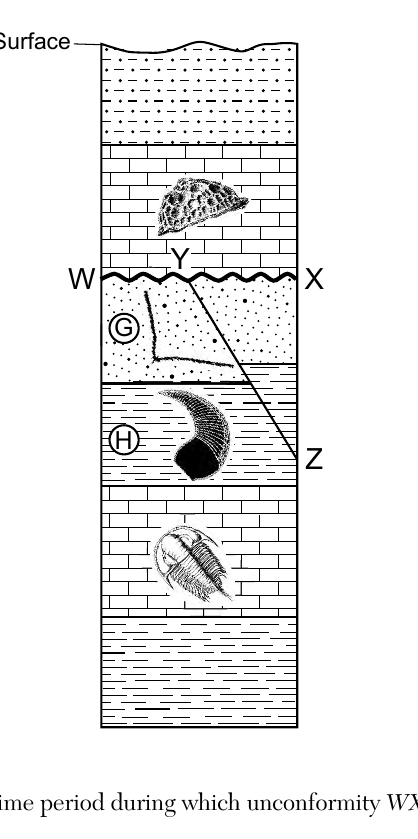
Base your answers to questions 66 and 67 on the cross section below and on your knowledge of Earth science. Letters G and H identify some rock layers. The wavy line WX indicates an unconformity, and line YZ indicates a fault. Index fossils are represented in some rock layers. Rock layers have not been overturned. In your answer booklet, circle the term that best describes the relative age of fault YZ compared to layers G and H. Describe the evidence that infers this relative age.
Worked solution
By the law of cross-cutting relationships, any fault or intrusion must be younger than all the rock layers it cuts through, so since YZ cuts both G and H, the fault formed after those layers were already in place.
Base your answers to questions 68 through 71 on the data table and passage below, and on your knowledge of Earth science. The data table shows the location and characteristics of seven stars, numbered 1 through 7, found in the constellation Cygnus. Location and Characteristics of Seven Stars in Cygnus | Star Number | Star Name | Celestial Longitude (hours) | Celestial Latitude (degrees) | Temperature (K) | Luminosity | | --- | --- | --- | --- | --- | --- | | 1 | Deneb | 20.7 | 45 | 8500 | 197,000 | | 2 | Sadr | 20.3 | 40 | 5800 | 60,000 | | 3 | Delta Cygni | 19.8 | 45 | 9800 | 180 | | 4 | Epsilon Cygni | 20.8 | 34 | 4800 | 60 | | 5 | Eta Cygni | 20 | 35 | 4840 | 54 | | 6 | Alberio | 19.5 | 28 | 4400 | 950 | | 7 | Tabby's Star | 20.1 | 44 | 6200 | 1.5 | The Mystery of Tabby's Star Located in the constellation of Cygnus, there is a mysterious star named Tabby's Star that has a constant luminosity, but has a brightness that appears to change in a cyclic manner. A team of astronomers has developed a plausible explanation for this change. A dust cloud with a variable thickness has an approximate 700-day period of revolution around Tabby's Star. Why dust? Astronomers observed that a portion of the electromagnetic spectrum having wavelengths just shorter than visible light is blocked out, causing a decrease in apparent brightness. While astronomers don't know the origin of the dust cloud around Tabby's Star, dust unevenly spaced in its orbit around the star would explain this cyclic dimming of Tabby's Star. On the grid in your answer booklet, plot the positions of stars 1 through 6. Record the star number of each star beside the plot. In order to create the correct shape of Cygnus, connect the plots with two lines: the first line connects the plots numbered 1-2-5-6; the second line connects the plots numbered 4-2-3. This position of Tabby's Star, number 7, has been indicated with a ⊕.
Worked solution
This is a plotting task on a celestial coordinate grid provided in the separate answer booklet, using the longitude/latitude values from the data table for each star.
Identify the planet in our solar system that has a period of revolution most similar to the dust cloud orbiting Tabby's Star.
Worked solution
Mars orbits the Sun in about 687 Earth days, which is closer to the dust cloud's 700-day period than any other planet's orbital period.
State the name of the shortwave electromagnetic energy that is mostly blocked out by the dust cloud orbiting Tabby's Star.
Worked solution
On the electromagnetic spectrum, the region with wavelengths just shorter than visible light is the ultraviolet band, so this is the shortwave energy being blocked by the dust.
Complete the table in your answer booklet by identifying the color and classification for two of the stars in the constellation Cygnus based on temperature and luminosity shown in the table. Color and classification for Deneb have been completed as an example.
Answer table to complete (Deneb is the completed example): | Star | Color | Classification | | --- | --- | --- | | Deneb (8500 K, luminosity 197,000) | White | Supergiant | | (choose a star from the data table) | ? | ? | | (choose a star from the data table) | ? | ? | Use the Characteristics of Stars chart in the Earth Science Reference Tables. Its horizontal axis is surface temperature in kelvins (hotter at the left), with star colors labeled across the top from hottest to coolest: Blue, Blue White, White, Yellow, Orange, Red. The vertical axis is luminosity (relative to the Sun = 1), from about 10^-6 at the bottom to about 10^6 at the top. Star groups on the chart: Supergiants (very high luminosity, top of chart), Giants (high luminosity, cooler side), Main Sequence (diagonal band from hot bright to cool dim; the Sun, 5800 K and luminosity 1, is a Yellow main sequence star), and White Dwarfs (hot but very dim, lower left). Classify each star by locating its temperature and luminosity on this chart: for example, stars near 4400 to 4840 K read as Orange in color; a star at 6200 K with luminosity 1.5 falls on the Main Sequence; a star at 4400 K with luminosity 950 falls in the Giants region.
Worked solution
Color is determined from a star's surface temperature and classification (main sequence, giant, supergiant, dwarf) is determined by plotting temperature against luminosity on the H-R type chart in the Earth Science Reference Tables.
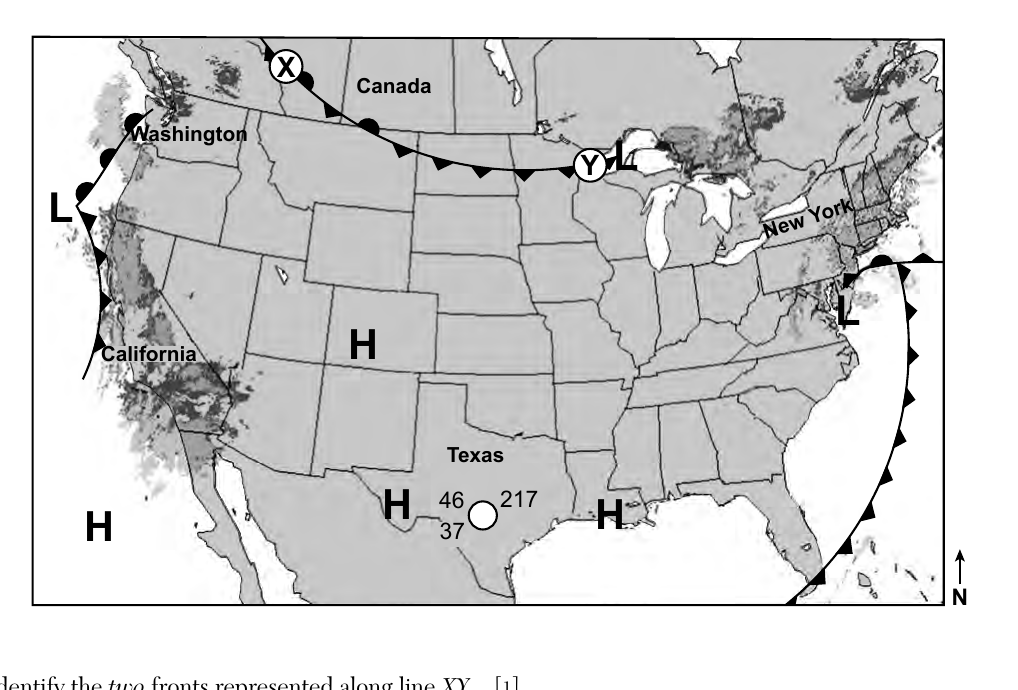
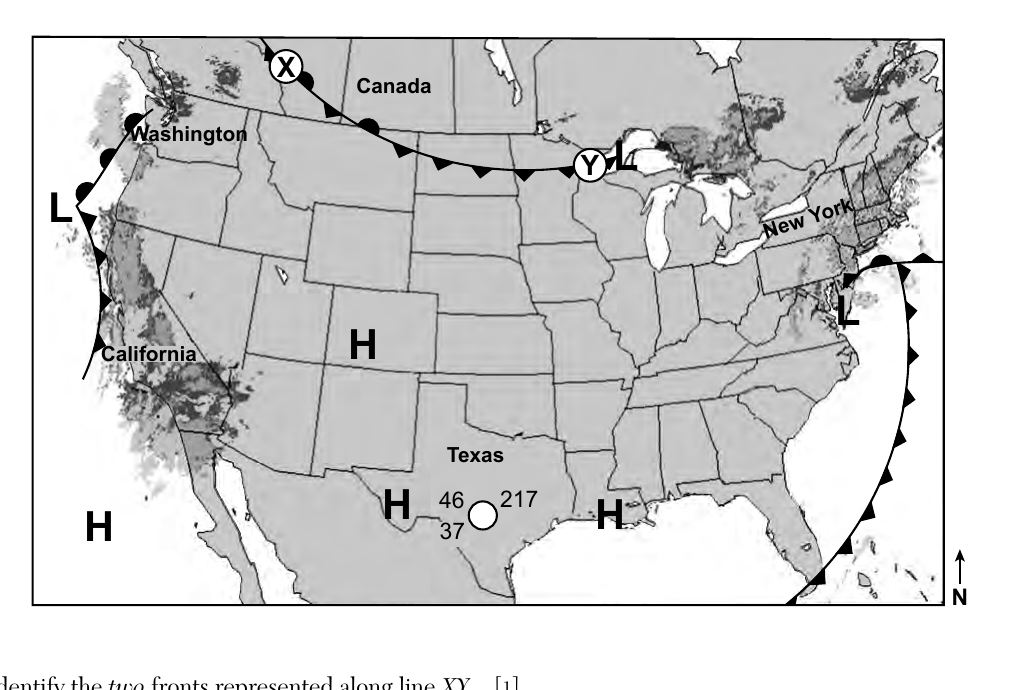
Base your answers to questions 72 through 74 on the weather map below and on your knowledge of Earth science. The weather map shows the high (H) and low (L) pressure centers and fronts across the United States on a January morning. The darker gray shaded areas show radar images of precipitation. A partial station model represents weather conditions in southern Texas. Two different types of fronts are represented along the line from X to Y. Identify the two fronts represented along line XY.
Worked solution
A single low-pressure system typically has a cold front trailing on one side and a warm front on the other; the two different symbol types along line XY represent these two different front types.
Identify the compass direction toward which the low-pressure system located just south of New York State will move if it follows a normal storm track.
Worked solution
Storms in the United States are steered by the prevailing westerlies and typically follow storm tracks moving from the southwest toward the northeast.
Complete the table in your answer booklet by filling in the values for the four weather variables that are represented by the station model. The partial station model over southern Texas shows the number 46 to the upper left of the station circle, 37 to the lower left of the station circle, and 217 to the upper right of the station circle, with an unfilled (open) station circle and no wind barb shown.
Worked solution
Station model conventions: upper-left is temperature, lower-left is dew point, upper-right coded number is sea-level pressure in tenths of a millibar (missing leading digits are inferred), and the shading/fill of the station circle indicates percent cloud cover.
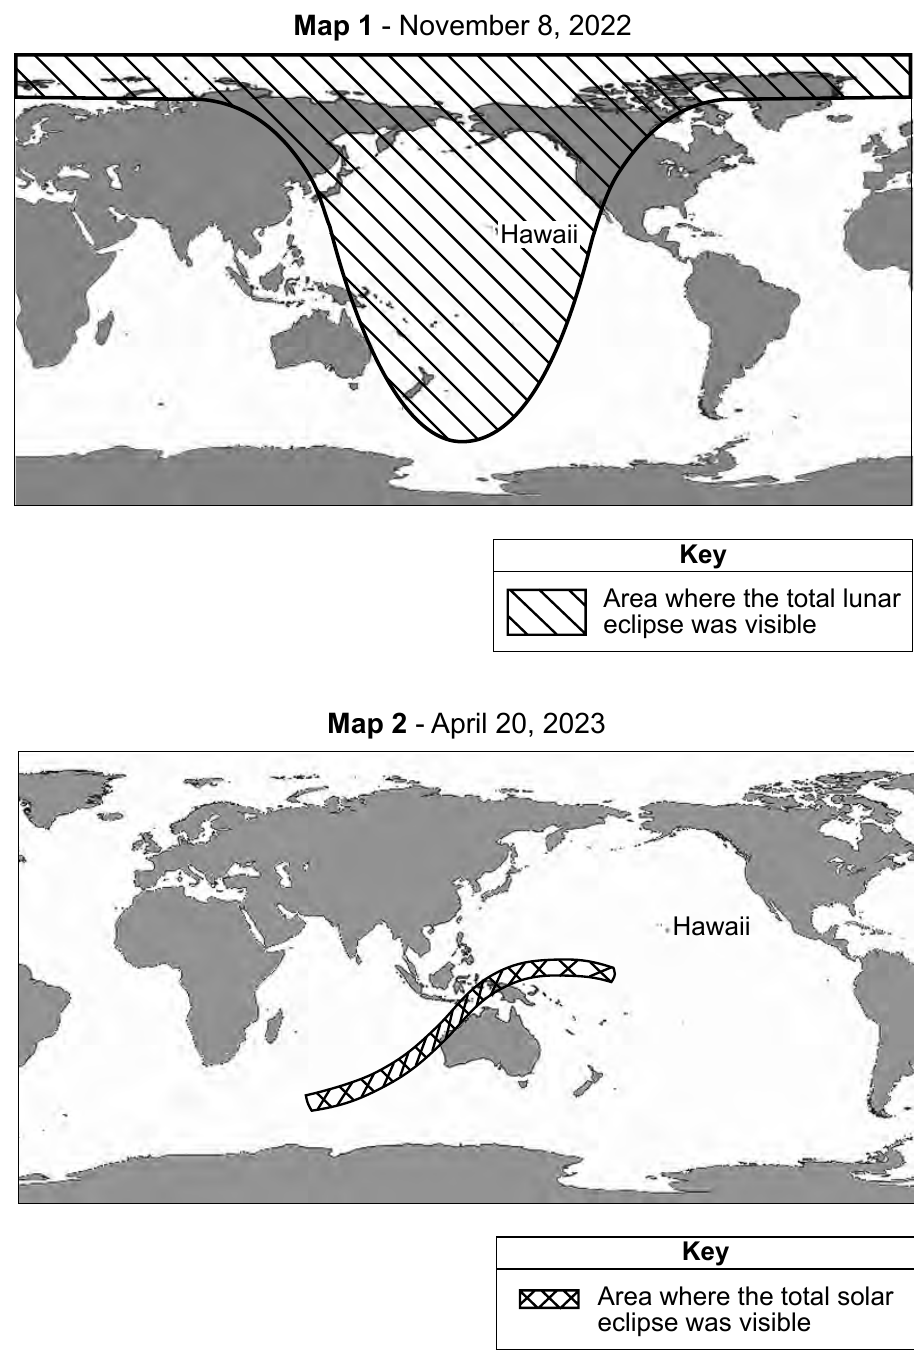
Base your answers to questions 75 and 76 on the maps and data table below and on your knowledge of Earth science. Map 1 shows the area where a total lunar eclipse was visible on November 8, 2022. Map 2 shows the area where a total solar eclipse was visible on April 20, 2023. The data table shows the date, type, and duration of totality for each total eclipse that has occurred or will occur at a specific location during the years 2022 through 2025. Total Eclipses 2022-2025 | Date | Type of Eclipse | Duration of Totality | | --- | --- | --- | | May 16, 2022 | lunar | 1 hour 25 minutes | | November 8, 2022 | lunar | 1 hour 25 minutes | | April 20, 2023 | solar | 1 minute 16 seconds | | April 8, 2024 | solar | 4 minutes 28 seconds | | March 14, 2025 | lunar | 1 hour 5 minutes | | September 7, 2025 | lunar | 1 hour 22 minutes | Determine whether each of the eclipses shown on the maps were visible or not visible to an observer in Hawaii. In your answer booklet, circle 'visible' or 'not visible' on the line next to the date of each eclipse.
Worked solution
Lunar eclipses are visible from wherever the Moon is above the horizon (roughly half of Earth at once), while solar eclipse totality is confined to a narrow path, so each eclipse's visibility from Hawaii depends on whether Hawaii fell within the relevant shaded region or path shown on the maps (or, by extension, in the actual eclipse geometry for dates not mapped).
On the diagram in your answer booklet, place an X on the Moon's orbit to indicate the position of the Moon on September 7, 2025.
The answer booklet diagram shows Earth at the center, viewed from above the North Pole, with the Moon's orbit drawn as a circle around Earth. Arrows labeled "Sunlight" enter the diagram from one side, indicating the direction of the Sun. On September 7, 2025, a total lunar eclipse occurred, so the Moon was in its full moon position: place the X on the Moon's orbit at the point directly opposite the Sun, on the far side of Earth from the incoming sunlight (in line with Earth's shadow).
Worked solution
Since a total lunar eclipse can only happen at the full moon phase, when Earth is directly between the Sun and Moon, the Moon's position on that date must be plotted on the far side of Earth's orbit from the Sun.
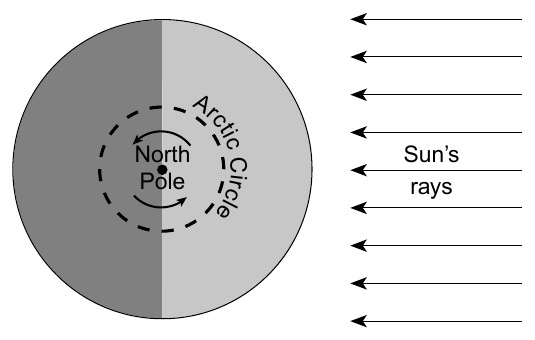
Base your answers to questions 77 and 78 on the diagram below and on your knowledge of Earth science. The diagram represents a North polar view of Earth as viewed from space on September 23. The curved arrows indicate the direction of Earth's rotation. State the number of degrees Earth's axis is tilted to a line perpendicular to the plane of its orbit.
Worked solution
This is a standard Earth science fact: Earth's rotational axis is tilted 23.5 degrees from the perpendicular to its orbital plane, which causes the seasons.
Explain why a Foucault pendulum located on the Arctic Circle appears to change direction as it swings.
Worked solution
A Foucault pendulum demonstrates Earth's rotation: the pendulum itself keeps swinging in the same fixed plane in space, while the ground beneath it turns, making the swing direction appear to shift relative to the surface.
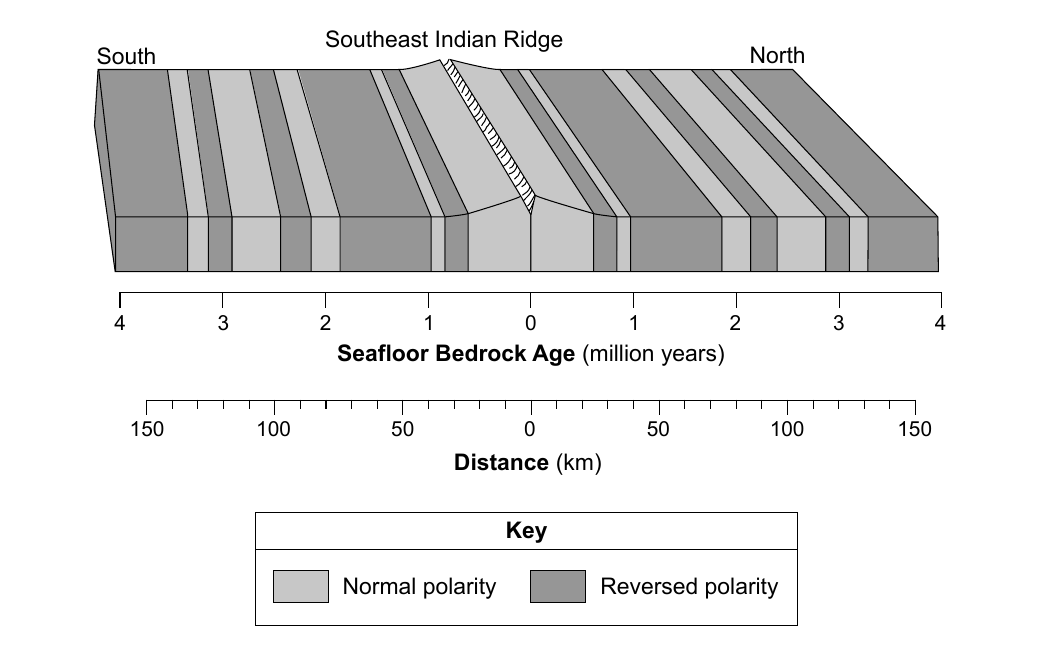
Base your answers to questions 79 through 81 on the block diagram below and on your knowledge of Earth science. The diagram represents the magnetic orientation of the seafloor bedrock on both sides of the Southeast Indian Ridge. The age of the igneous bedrock and its distance, in kilometers, from the ridge center are shown. Determine the age and the magnetic orientation of the seafloor bedrock located 80 kilometers south of the ridge center.
Worked solution
Using the roughly linear relationship between distance from the ridge and bedrock age shown on the two aligned scales, 80 km from the ridge corresponds to about 2 million years old bedrock, which the diagram shows lies within a reversed-polarity band.
Identify the two tectonic plates that are diverging at the Southeast Indian Ridge.
Worked solution
The Southeast Indian Ridge is the mid-ocean spreading boundary between the Australian Plate and the Antarctic Plate, where new oceanic crust forms as the two plates move apart.
Explain, in terms of cooling rate, why surface oceanic crust forming at this ocean ridge is most likely basalt instead of gabbro.
The diagram represents the magnetic orientation of the seafloor bedrock on both sides of the Southeast Indian Ridge. The age of the igneous bedrock and its distance, in kilometers, from the ridge center are shown.
Worked solution
Basalt and gabbro have the same (mafic) chemical composition but differ in cooling rate and resulting texture; rapid surface cooling at the ridge produces basalt's fine grains, while gabbro requires slow, deep cooling to form large crystals.
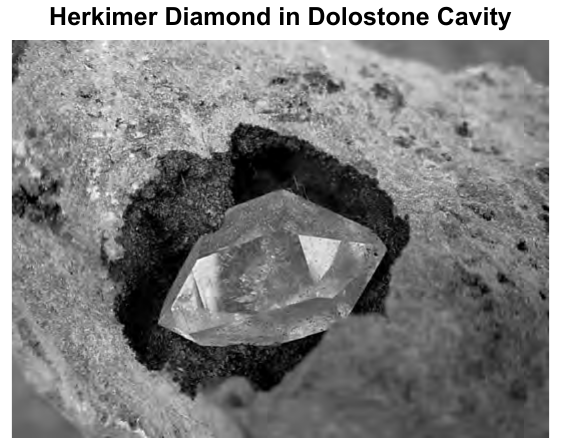
Base your answers to questions 82 through 85 on the passage and photograph below and on your knowledge of Earth science. The photograph shows a Herkimer diamond located in a cavity in dolostone. Herkimer Diamonds Herkimer 'diamonds' are actually quartz crystals that are double terminated (pointed at both ends) and found within exposed outcrops of dolostone around the Mohawk River Valley. The dolostone was formed about 500 million years ago in a shallow sea that was filled with sediment from the eroded ancient Adirondack Mountains to the north. While buried, cavities were formed in the dolostone by the slightly acidic ocean water. As sediment buried the rock, crystals grew in the cavities, slowly creating quartz crystals of exceptional clarity. The quartz crystals in the cavities are believed to have formed during the Carboniferous Period. Source: "Herkimer Diamonds" Geology.com Identify the chemical composition of the quartz that makes up a Herkimer diamond.
Worked solution
Quartz, the mineral making up Herkimer diamonds, has the chemical formula SiO2 (silicon dioxide), as listed in the Earth Science Reference Tables mineral chart.
Identify one physical characteristic of a Herkimer diamond, other than its color, that allows it to be used in jewelry.
Worked solution
Besides color, gem-quality minerals need durability to be worn as jewelry; quartz's hardness of 7 (or alternatively its glassy luster/transparency/clarity) makes it resistant to scratching, which is why Herkimer diamonds are usable in jewelry.
Identify the orogeny that was responsible for the metamorphism of bedrock now exposed in the Adirondack Mountains.
Worked solution
The Adirondack Mountains' metamorphic bedrock (gneiss, etc.) resulted from the Grenville orogeny, a major Precambrian episode of mountain building and metamorphism, as identified in the Earth Science Reference Tables geologic history chart.
In your answer booklet, circle the term that describes the relative age of the Herkimer diamonds compared to the relative age of the dolostone. Explain how the evidence cited in the reading passage supports your answer. Use the terms Herkimer diamonds and dolostone in your explanation.
Worked solution
Using the principle that a mineral filling a cavity in a rock must be younger than the rock that contains the cavity, the passage's sequence (dolostone forms, then cavities form, then Herkimer diamond quartz crystals grow inside the cavities) shows the Herkimer diamonds are younger than the dolostone.