June 2023 Earth Science Regents — Answer Key & Worked Solutions
Every question from the June 2023 Earth Science Regents exam, with the correct answer and a full step-by-step solution. Check your work, learn the method, then convert your raw score.
These are real questions from the June 2023 Earth Science New York State Regents examination, published by NYSED. Worked solutions are written by RegentsLab.
Which two characteristics classify Jupiter as a Jovian planet?
- (A) low density and large diameter ✓
- (B) low density and small diameter
- (C) high density and large diameter
- (D) high density and small diameter
Worked solution
Jovian planets like Jupiter are large-diameter gas giants with low overall density, unlike small, dense terrestrial planets.
As observed from Earth, the wavelengths of light from the most distant galaxies are usually
- (A) blue shifted due to an expanding universe
- (B) blue shifted due to a contracting universe
- (C) red shifted due to an expanding universe ✓
- (D) red shifted due to a contracting universe
Worked solution
Redshift of distant galaxies is evidence that the universe is expanding, per the Doppler effect applied to light.
The rate of Earth's revolution around the Sun is approximately
- (A) 1°/day ✓
- (B) 15°/day
- (C) 24°/day
- (D) 360°/day
Worked solution
Earth completes 360° of orbit in about 365 days, roughly 1° per day.
Different star constellations are observed from Earth at different times during the year because
- (A) constellations spin on an axis
- (B) constellations travel in an orbit around the Sun
- (C) Earth spins on its axis
- (D) Earth travels in an orbit around the Sun ✓
Worked solution
Earth's revolution around the Sun changes which constellations are visible in the night sky at different times of year.
The apparent change in the direction of swing of a Foucault pendulum provides evidence of Earth's
- (A) rotation ✓
- (B) revolution
- (C) tilted axis
- (D) elliptical orbit
Worked solution
A Foucault pendulum's apparent shift in swing direction is classic evidence of Earth's rotation on its axis.
The Milky Way can best be described as
- (A) an elliptical galaxy
- (B) a collection of stars orbiting the Sun
- (C) a star that originated 4600 million years ago
- (D) one of billions of galaxies in the universe ✓
Worked solution
The Milky Way is one galaxy among billions that make up the observable universe.
How much heat energy is required to change five grams of ice to liquid water at 0°C?
- (A) 334 joules
- (B) 1670 joules ✓
- (C) 2260 joules
- (D) 11,300 joules
Worked solution
Melting ice at 0°C requires the heat of fusion (334 J/g); multiplying by 5 grams gives 1670 joules.
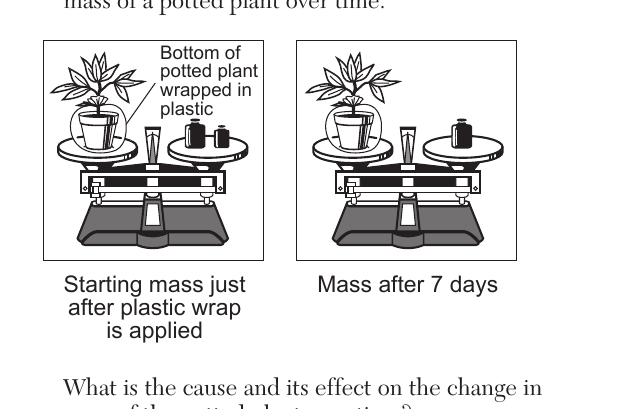
The diagram below represents the change in mass of a potted plant over time. Bottom of potted plant wrapped in plastic. Starting mass just after plastic wrap is applied; mass after 7 days. What is the cause and its effect on the change in mass of the potted plant over time?
- (A) Transpiration caused a decrease in mass. ✓
- (B) Condensation caused a decrease in mass.
- (C) Transpiration caused an increase in mass.
- (D) Condensation caused an increase in mass.
Worked solution
With the soil sealed off, water lost from the plant via transpiration through its leaves is not replaced, so the plant's mass decreases over the 7 days.
Air temperatures are recorded as a weather balloon rises from Earth's surface. At first, the air temperature constantly decreases for 12 kilometers, then remains constant briefly before increasing for another 12 kilometers before the balloon bursts. In which layer did the balloon burst?
- (A) troposphere
- (B) stratosphere ✓
- (C) mesosphere
- (D) thermosphere
Worked solution
Temperature decreases through the troposphere, levels off at the tropopause, then increases through the stratosphere due to ozone absorbing UV radiation, which is where the balloon bursts.
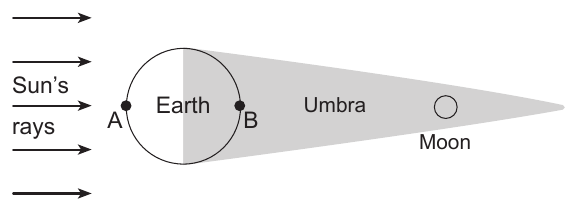
The diagram below represents the Moon passing through the darker part of Earth's shadow called the umbra. Letters A and B represent locations on Earth's surface. The diagram shows parallel Sun's rays arrows striking Earth from the left; Earth is a circle with location A on the left (sunlit) side and location B on the right (shadowed) side; the umbra extends to the right of Earth as a narrowing shaded cone, with the Moon shown at the tip of the umbra, far to the right. Which statement best identifies this event and at which location it would be viewed?
- (A) A solar eclipse is occurring and can be seen from location A.
- (B) A solar eclipse is occurring and can be seen from location B.
- (C) A lunar eclipse is occurring and can be seen from location A.
- (D) A lunar eclipse is occurring and can be seen from location B. ✓
Worked solution
Earth's shadow (umbra) falling on the Moon defines a lunar eclipse, and only the night-side location B, facing the Moon, could observe it.
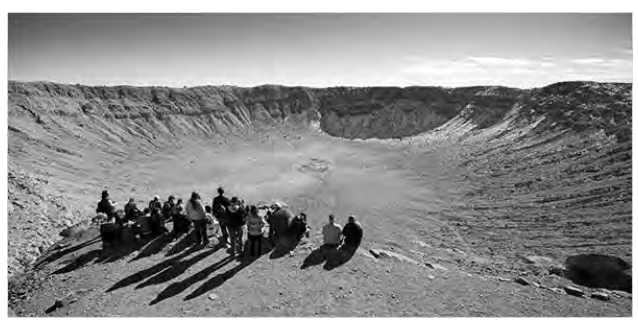
The photograph below shows an impact crater located in the southwestern United States. This crater most likely formed as a result of
- (A) an explosive volcanic eruption
- (B) the subduction at a plate boundary
- (C) an asteroid colliding with Earth ✓
- (D) the evaporation of water from a lake
Worked solution
The bowl-shaped crater with an elevated rim, shown in a stable continental area, is characteristic of an asteroid impact rather than volcanic or tectonic processes.
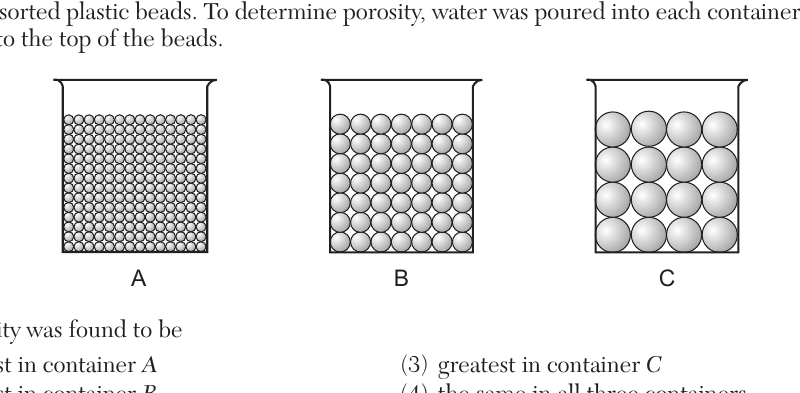
The diagrams below represent three containers, A, B, and C, which were filled with equal volumes of uniformly sorted plastic beads of different sizes (small beads in A, medium beads in B, large beads in C). To determine porosity, water was poured into each container until the water level rose to the top of the beads. The porosity was found to be
- (A) greatest in container A
- (B) greatest in container B
- (C) greatest in container C
- (D) the same in all three containers ✓
Worked solution
For uniformly sorted spherical particles packed the same way, porosity is independent of particle size, so all three containers have the same porosity.
Which cross section represents the cloud patterns and the direction of air movement at a warm front? Four labeled cross-section diagrams (1) through (4) each show cool air and warm air arrows meeting at a sloped boundary at Earth's surface, with cloud shapes above the boundary.
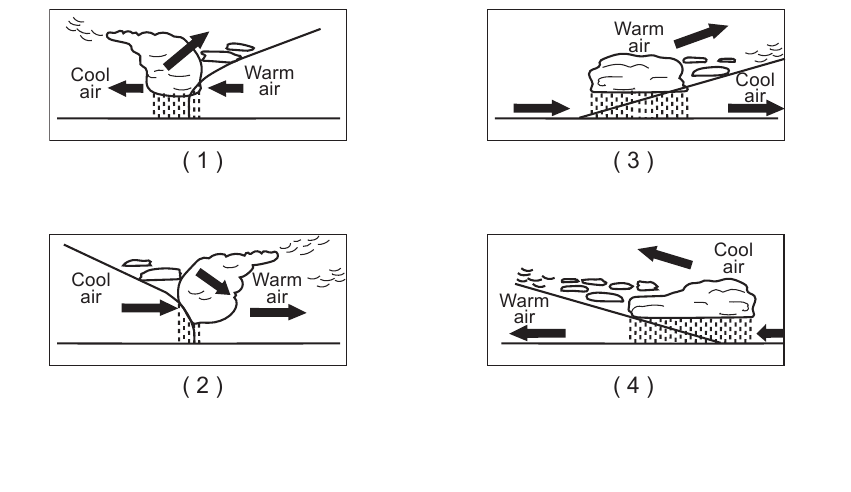
- (A) Diagram (1): steep frontal boundary with warm air advancing from the right and being forced up steeply as cool air retreats to the left, cumulus-type clouds directly over the front (cold-front pattern).
- (B) Diagram (2): steep frontal boundary with cool air advancing from the left and warm air pushed up steeply, cumulus-type clouds over the front (cold-front pattern).
- (C) Diagram (3): gently sloping boundary with warm air overriding retreating cool air, layered clouds (cirrus, then progressively lower/thicker clouds) extending far ahead of the surface front, both air masses moving to the right. ✓
- (D) Diagram (4): gently sloping boundary with warm air (on the left) advancing over cool air (on the right), layered clouds extending ahead of the front, both air masses moving to the left.
Worked solution
A warm front has a low-angle slope where warm air overrides cooler air, producing a wide swath of progressively thickening layered clouds ahead of the surface front, matching the pattern in diagram 3.
Which map shows the most likely path of a low pressure system (L) in the United States if it follows a normal storm track?
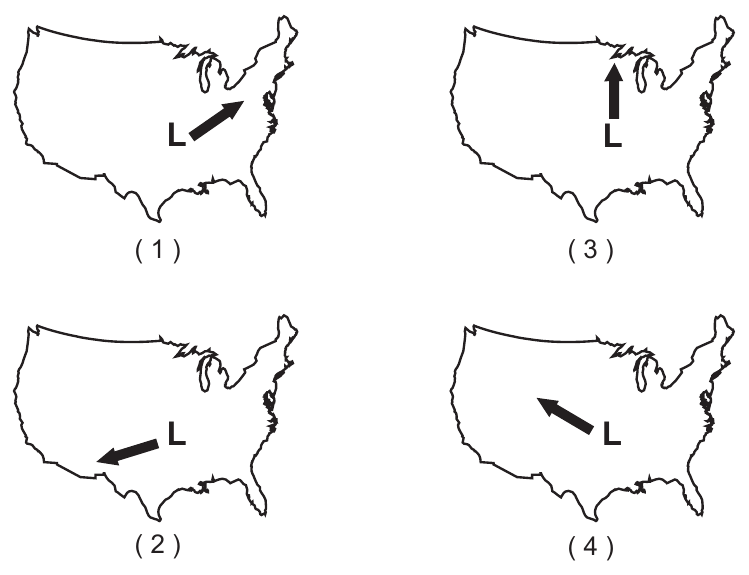
- (A) Map (1): L moves from southwest to northeast ✓
- (B) Map (2): L moves from northeast to southwest
- (C) Map (3): L moves due north
- (D) Map (4): L moves from southeast to northwest
Worked solution
Normal storm tracks in the United States move from southwest to northeast, following the prevailing westerlies, matching map (1).
Which weather instrument is an anemometer?
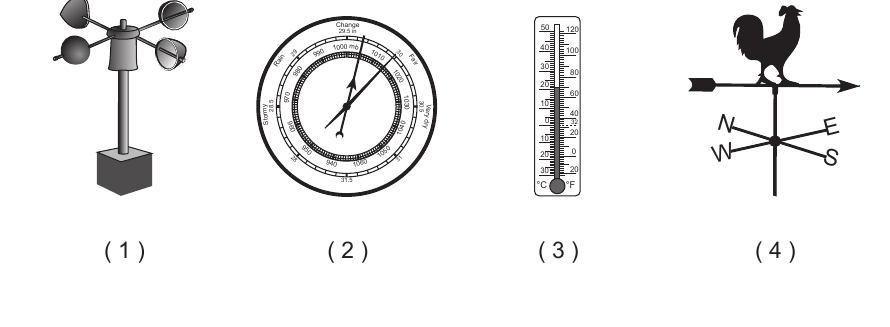
- (A) Image (1): rotating cup instrument ✓
- (B) Image (2): circular dial gauge instrument
- (C) Image (3): glass tube thermometer
- (D) Image (4): arrow-and-rooster weather vane
Worked solution
The rotating-cup instrument (image 1) is an anemometer, used to measure wind speed; the others are a barometer, thermometer, and wind vane respectively.
The station model below represents some weather information for a location in New York State. The station model shows the number 73 above and to the left of the station circle, a wind barb extending to the upper right from the circle with a present-weather symbol and the number 2 near it, the station circle is completely filled in (solid black), and the number 72 is shown below and to the left of the circle. Based on the information on the station model, the weather at this location is
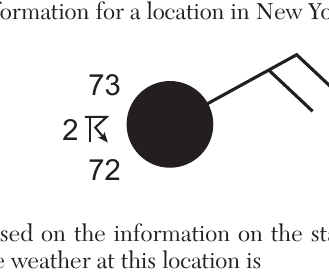
- (A) partly cloudy and windy with blowing snow
- (B) cloudy and windy with thunderstorms ✓
- (C) cloudy and calm with visibility of 2 miles
- (D) partly cloudy and calm with an air temperature of 73°F
Worked solution
The fully shaded station circle shows overcast sky, the attached wind barb shows wind, and the plotted present-weather symbol indicates thunderstorms, matching choice 2.
Electromagnetic energy travels through space from the Sun to the top of Earth's atmosphere by
- (A) conduction
- (B) convection
- (C) radiation ✓
- (D) infiltration
Worked solution
Radiation is electromagnetic energy transfer that can travel through the vacuum of space, unlike conduction or convection which require matter.
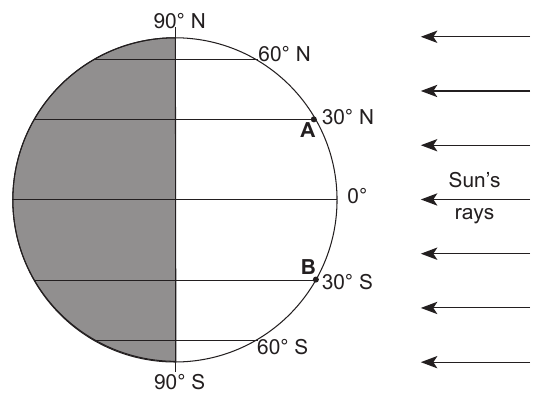
The diagram below represents the position of Earth with respect to the Sun on March 21. A and B are two locations on Earth's surface, with A at 30° N latitude and B at 30° S latitude; parallel Sun's rays arrows strike Earth from the right side of the diagram. The intensity of insolation over the next three months will
- (A) decrease for both A and B
- (B) decrease for A and increase for B
- (C) increase for both A and B
- (D) increase for A and decrease for B ✓
Worked solution
Moving from the March equinox toward the June solstice, the Northern Hemisphere (A) receives increasing insolation while the Southern Hemisphere (B) receives decreasing insolation.
Which event is primarily responsible for the production of oxygen that first entered into Earth's early atmosphere?
- (A) evolution of oxygen-producing organisms ✓
- (B) radioactive decay of isotopes producing oxygen
- (C) separation of oxygen from hydrogen in water
- (D) oxygen-rich comets impacting Earth
Worked solution
Free oxygen first accumulated in Earth's atmosphere as a byproduct of photosynthesis carried out by early oxygen-producing organisms.
Since the break up of Pangaea, it has been inferred that the continent of North America has been generally moving toward the
- (A) northwest ✓
- (B) northeast
- (C) southwest
- (D) southeast
Worked solution
Geologic and paleomagnetic evidence indicates the North American plate has generally drifted northwest since Pangaea broke apart.
The fossil Mucrospirifer is considered to be an index fossil because it existed over a
- (A) small geographic region for a long period of time
- (B) small geographic region for a short period of time
- (C) large geographic region for a long period of time
- (D) large geographic region for a short period of time ✓
Worked solution
Index fossils, such as Mucrospirifer, are useful for dating rock layers because they were widespread geographically but existed only for a short geologic time span.
Compared to Earth's outer core, the inner core properties are inferred to be
- (A) less dense and a solid
- (B) less dense and a liquid
- (C) more dense and a solid ✓
- (D) more dense and a liquid
Worked solution
The inner core is inferred to be solid due to extreme pressure, and denser than the liquid outer core because of its greater depth and compression.
A seismic station 4000 kilometers from the epicenter of an earthquake records the arrival time of the first S-wave at 1:05:40 p.m. At what time did the first P-wave arrive at this station?
- (A) 12:58:40 p.m.
- (B) 1:00:00 p.m. ✓
- (C) 1:05:40 p.m.
- (D) 1:11:20 p.m.
Worked solution
Using the Reference Tables travel-time graph, the P-S interval at 4000 km is about 5 min 40 s, so subtracting this from the S-wave arrival time gives the P-wave arrival time.
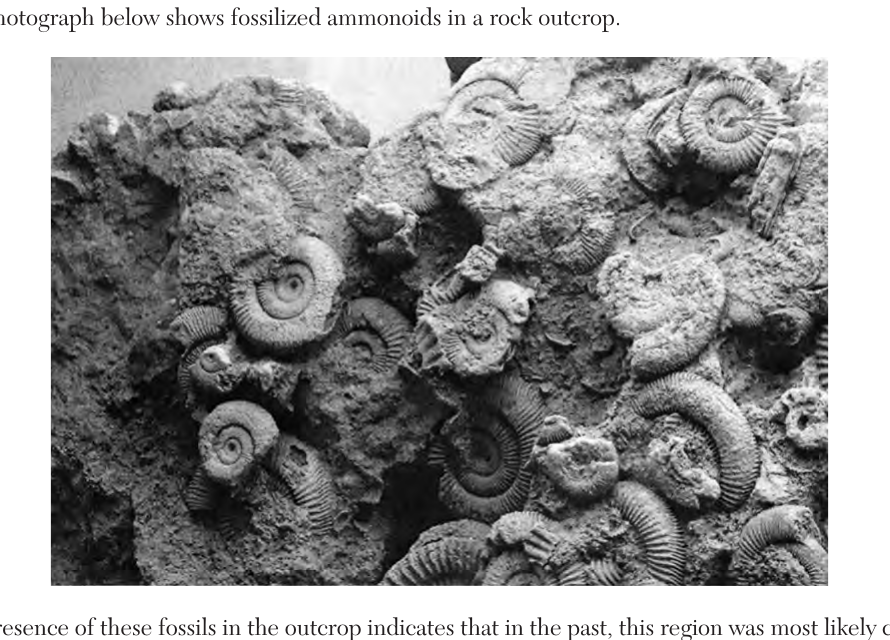
The photograph below shows fossilized ammonoids in a rock outcrop. The presence of these fossils in the outcrop indicates that in the past, this region was most likely covered by
- (A) desert sand
- (B) ocean water ✓
- (C) glacial ice
- (D) molten rock
Worked solution
Ammonoids are extinct marine cephalopods, so their fossils indicate the region was once covered by ocean water.
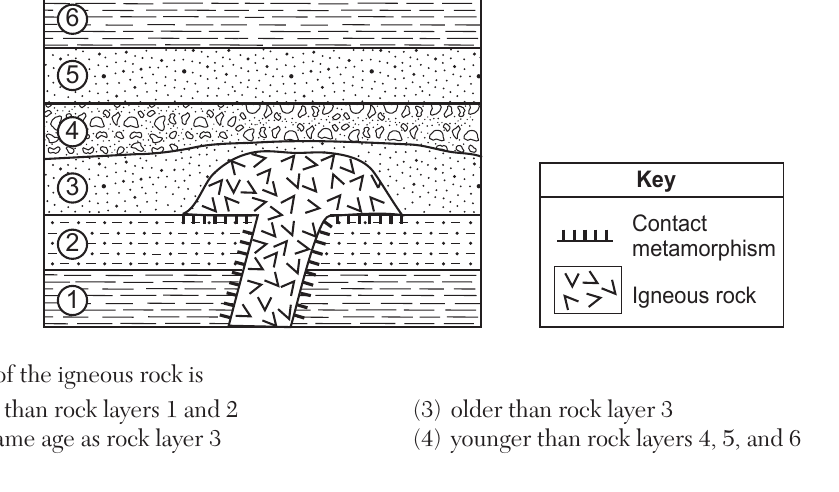
The cross section below represents rock units within Earth's crust. Sedimentary rock layers are labeled 1 through 6, from bottom (1) to top (6). An igneous intrusion cuts through layers 1, 2, and 3, and layer 4 shows contact metamorphism directly above the intrusion but layers 5 and 6 do not. The age of the igneous rock is
- (A) older than rock layers 1 and 2
- (B) the same age as rock layer 3
- (C) older than rock layer 3 ✓
- (D) younger than rock layers 4, 5, and 6
Worked solution
Contact metamorphism, the baked zone shown in the key, appears only along the narrow neck of the intrusion where it cuts through rock layers 1 and 2, showing those layers already existed when the magma intruded and making the intrusion younger than layers 1 and 2. Layer 3, however, is neither cut through nor baked anywhere along the rounded top of the intrusion, so layer 3 could only have been deposited after the intrusion had already solidified and cooled. Since a rock layer must already be present to be cut or baked by magma, and layer 3 shows neither effect, the intrusion must predate layer 3, making it older.
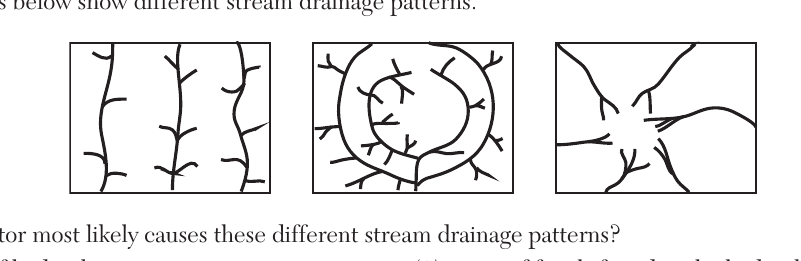
The maps below show different stream drainage patterns (dendritic, radial, and trellis-like patterns shown as three separate boxes). What factor most likely causes these different stream drainage patterns?
- (A) age of bedrock
- (B) bedrock structure ✓
- (C) types of fossils found in the bedrock
- (D) temperature variations in the bedrock
Worked solution
Stream drainage patterns develop in response to the underlying bedrock structure, such as jointing, folding, or differences in rock resistance to erosion.
The photograph below shows boulders and other sediments that slid down a hillside. This rock slide is most likely an example of
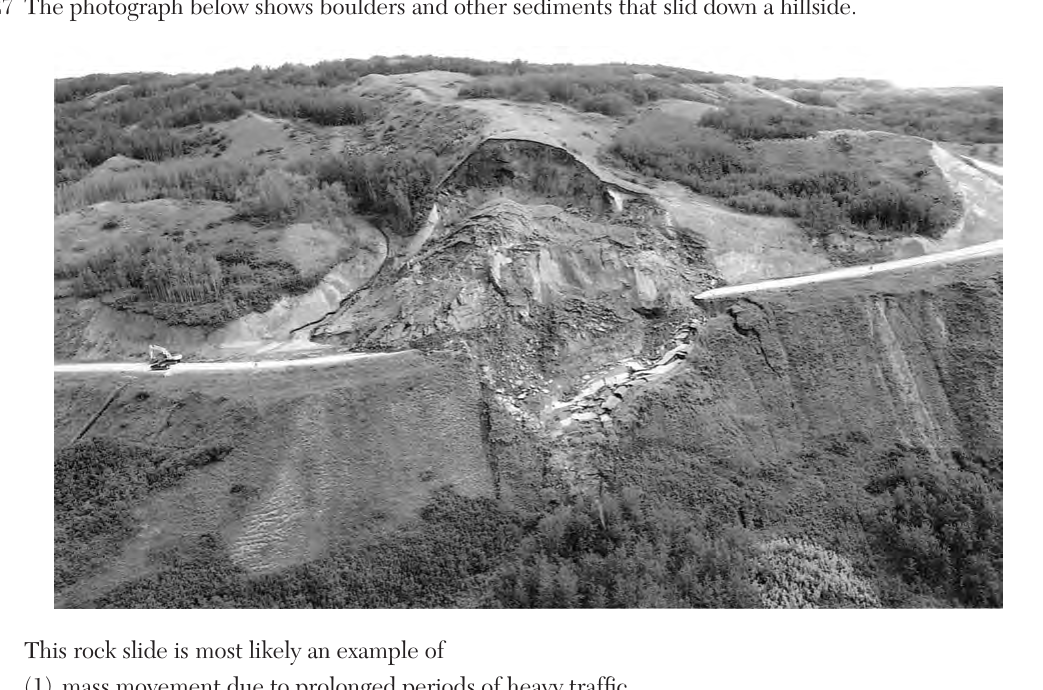
- (A) mass movement due to prolonged periods of heavy traffic
- (B) mass movement following prolonged periods of heavy rain ✓
- (C) abrasion by prolonged exposure to moving ice
- (D) abrasion following prolonged exposure to wind action
Worked solution
A rock slide down a hillside is a form of mass movement, typically triggered by saturation of the slope material after prolonged heavy rain reducing internal friction.
The Mariana Trench is Earth's deepest oceanic trench. This trench formed as the Pacific Plate was
- (A) overriding the Philippine Plate
- (B) overriding the Eurasian Plate
- (C) subducting under the Philippine Plate ✓
- (D) subducting under the Eurasian Plate
Worked solution
The Mariana Trench formed where the denser Pacific Plate subducts beneath the Philippine Plate, creating the deepest oceanic trench on Earth.
The diagram below represents patterns of normal and reverse magnetic polarity in seafloor bedrock, symmetric about a central ridge. In which bedrock type and location can this magnetic pattern most likely be observed?
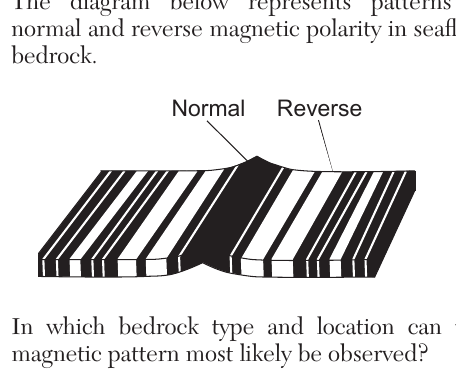
- (A) igneous bedrock at the East Pacific Ridge ✓
- (B) igneous bedrock at the Tasman Hot Spot
- (C) sedimentary bedrock at the East Pacific Ridge
- (D) sedimentary bedrock at the Tasman Hot Spot
Worked solution
Symmetric bands of normal and reversed magnetic polarity form in newly formed igneous seafloor rock at spreading mid-ocean ridges, such as the East Pacific Ridge.
Compared to the thickness and density of the continental crust, the relative thickness and density of Earth's oceanic crust are
- (A) thinner and less dense
- (B) thinner and more dense ✓
- (C) thicker and less dense
- (D) thicker and more dense
Worked solution
Oceanic crust is composed of denser basaltic rock and is thinner than continental crust, which is thicker and composed of less dense granitic rock.
Iron found in some minerals in basalt can react with oxygen and break down into iron oxide particles. This change is an example of
- (A) deposition
- (B) erosion
- (C) chemical weathering ✓
- (D) physical weathering
Worked solution
The reaction of iron with oxygen to form iron oxide is a chemical change that alters the mineral composition, which is chemical weathering (oxidation).
Which feature provides the best evidence that thick glacial ice sheets once advanced southward over New York State?
- (A) parallel grooves in bedrock ✓
- (B) sorted layers of sediments
- (C) caves found in limestone bedrock
- (D) V-shaped valleys
Worked solution
Parallel grooves (glacial striations) scratched into bedrock by rock debris embedded in moving ice sheets directly indicate the direction and presence of past glacial advance.
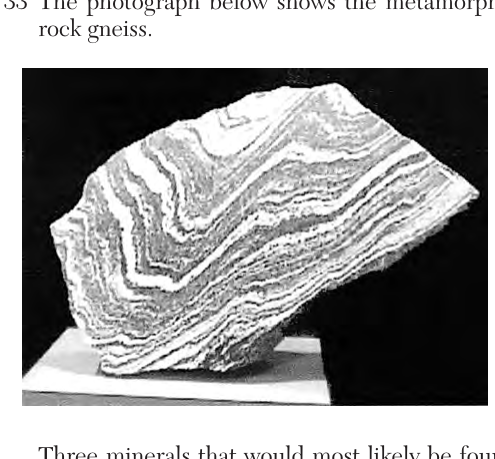
The photograph below shows the metamorphic rock gneiss. Three minerals that would most likely be found in this rock are
- (A) pyroxene, calcite, and fluorite
- (B) garnet, hornblende, and talc
- (C) amphibole, augite, and hematite
- (D) quartz, mica, and feldspar ✓
Worked solution
Gneiss is a high-grade foliated metamorphic rock typically derived from granite, so it commonly contains quartz, mica, and feldspar, matching the Reference Tables scheme for gneiss.
Which igneous rock has a fine-grained texture and would have a mineral composition of 57% plagioclase feldspar, 28% amphibole, and 15% biotite?
- (A) gabbro
- (B) pegmatite
- (C) scoria
- (D) andesite ✓
Worked solution
This mineral composition (plagioclase feldspar, amphibole, biotite) corresponds to the intermediate compositional column on the Igneous Rock Identification chart; with fine-grained texture, this is andesite.
What is a common use of the mineral composed of $Fe_3Al_2Si_3O_{12}$?
- (A) ceramics
- (B) jewelry ✓
- (C) building stones
- (D) plaster of paris
Worked solution
The formula Fe3Al2Si3O12 corresponds to garnet on the Reference Tables, and garnet's common use listed there is jewelry.
Base your answer on the passage below. King Tides and Climate Change Spring tides are extremely high tides that occur when Earth, the Moon, and the Sun are aligned. A king tide is the common name given to an extremely high spring tide that occurs at perigee (when the Moon is closest to Earth in its orbit). King tides occur once or twice every year. Normal high tides are now reaching higher and extending farther inland than in the past because of global climate change and rising sea levels. This causes low-lying shorelines to be at an increased risk of flooding. If climate continues to change and sea levels rise, spring tides and king tides will have a greater effect on shorelines and coastal flooding. Which diagram best illustrates the positions of Earth (E), the Sun (S), and the Moon (M), and the relative distance between Earth and the Moon that results in a king tide?
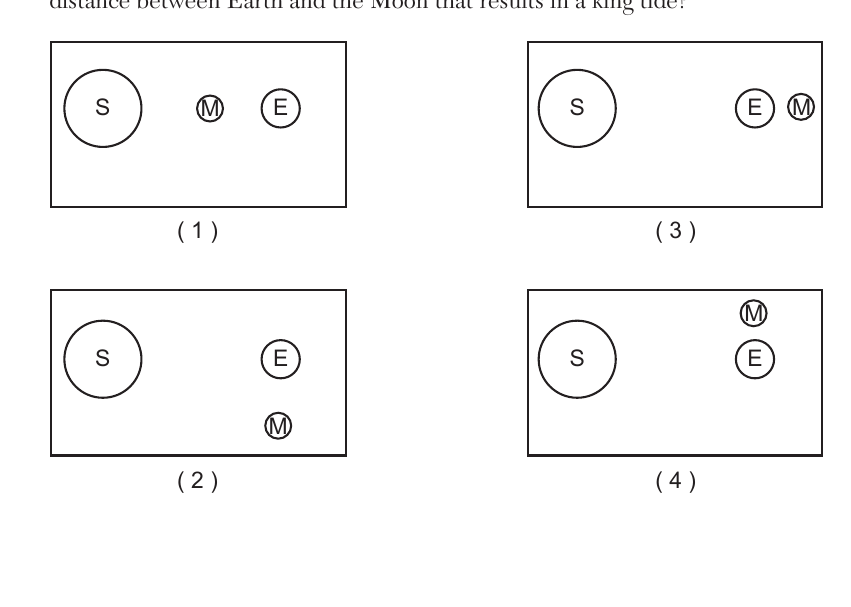
- (A) Diagram 1: S on far left, M in middle position, E on right, with M positioned between S and E but not aligned with E and S on the same line at closest approach
- (B) Diagram 2: S on left, E on right, with M positioned below/offset from the S-E line
- (C) Diagram 3: S on far left, E and M aligned close together on the right (Earth, Sun, Moon in a straight line with Moon near Earth, at closest distance) ✓
- (D) Diagram 4: S on left, E on right, with M positioned above/offset from the S-E line, not aligned
Worked solution
A king tide requires the Sun, Earth, and Moon to be aligned in a straight line (syzygy) with the Moon at its closest orbital distance to Earth (perigee), which is shown in diagram 3.
A coastal community can make advanced preparations for a king tide event because the motions of Earth and the Moon are
- (A) cyclic and predictable ✓
- (B) cyclic and unpredictable
- (C) noncyclic and predictable
- (D) noncyclic and unpredictable
Worked solution
The orbital motions of Earth and the Moon are regular and repeating (cyclic), which allows their positions, and therefore tide events, to be predicted well in advance.
Which factor is primarily causing global average sea levels to rise over time?
- (A) decreased incoming solar radiation
- (B) decreased ocean water temperature
- (C) increased amount of snowfall in Arctic regions
- (D) increased melting of glacial ice ✓
Worked solution
The primary cause of global average sea level rise is the increased melting of glacial ice (and ice sheets), which adds additional water to the oceans.
Two major greenhouse gases that may be linked to global warming are
- (A) carbon dioxide and nitrogen
- (B) carbon dioxide and methane ✓
- (C) oxygen and nitrogen
- (D) oxygen and methane
Worked solution
Carbon dioxide and methane are two major greenhouse gases that trap heat in Earth's atmosphere and are linked to global warming, unlike nitrogen and oxygen which are not significant greenhouse gases.
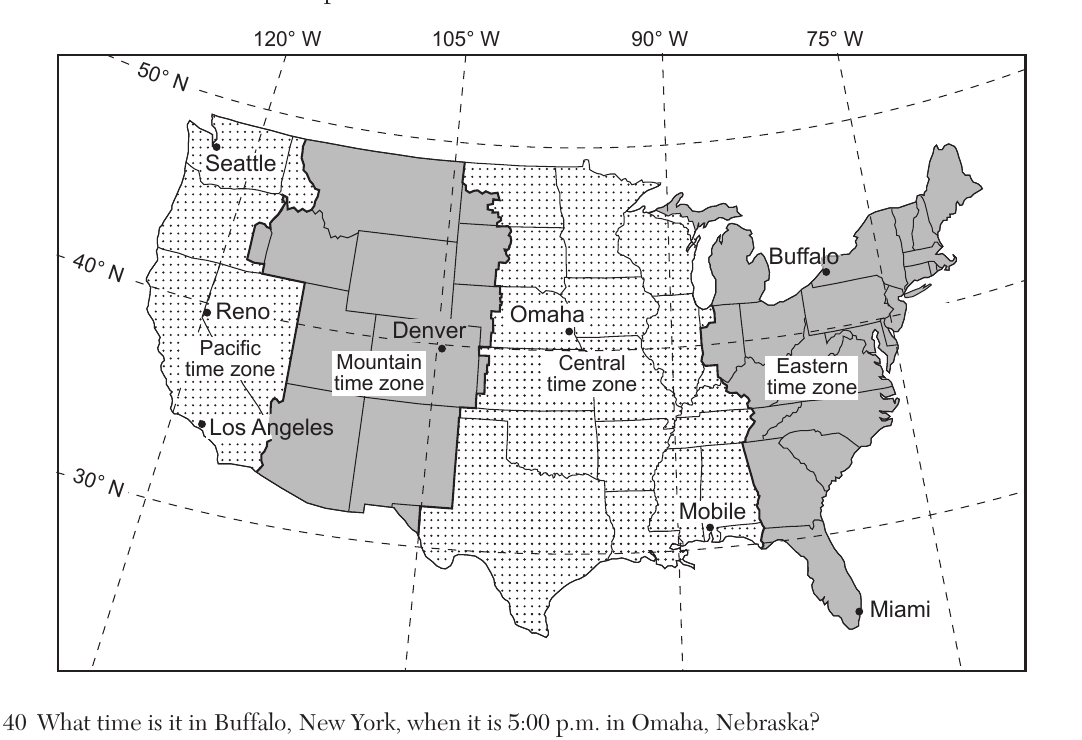
Base your answers on the map showing the four time zones and some latitude and longitude lines across the continental United States. Buffalo is in the Eastern time zone; Omaha is in the Central time zone. What time is it in Buffalo, New York, when it is 5:00 p.m. in Omaha, Nebraska?
- (A) 6:00 p.m. ✓
- (B) 7:00 p.m.
- (C) 3:00 p.m.
- (D) 4:00 p.m.
Worked solution
Buffalo is in the Eastern time zone, which is one hour ahead of the Central time zone where Omaha is located, so 5:00 p.m. Central time is 6:00 p.m. Eastern time.
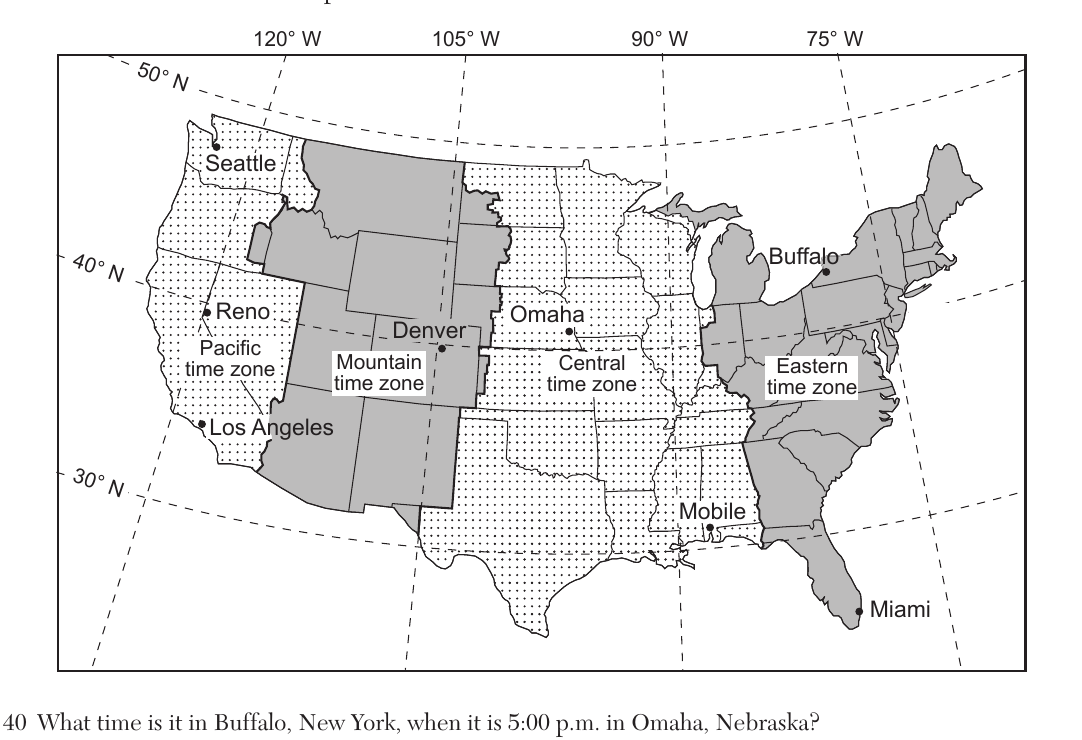
Base your answers on the map showing the four time zones and some latitude and longitude lines across the continental United States. Reno, Nevada is located at approximately 40 degrees N latitude. The altitude of Polaris, as measured by an observer in Reno, Nevada, is closest to
- (A) $39°$ ✓
- (B) $41°$
- (C) $119°$
- (D) $121°$
Worked solution
The altitude of Polaris above the northern horizon is numerically equal to the observer's latitude; Reno's latitude on the map is approximately 39-40 degrees N.
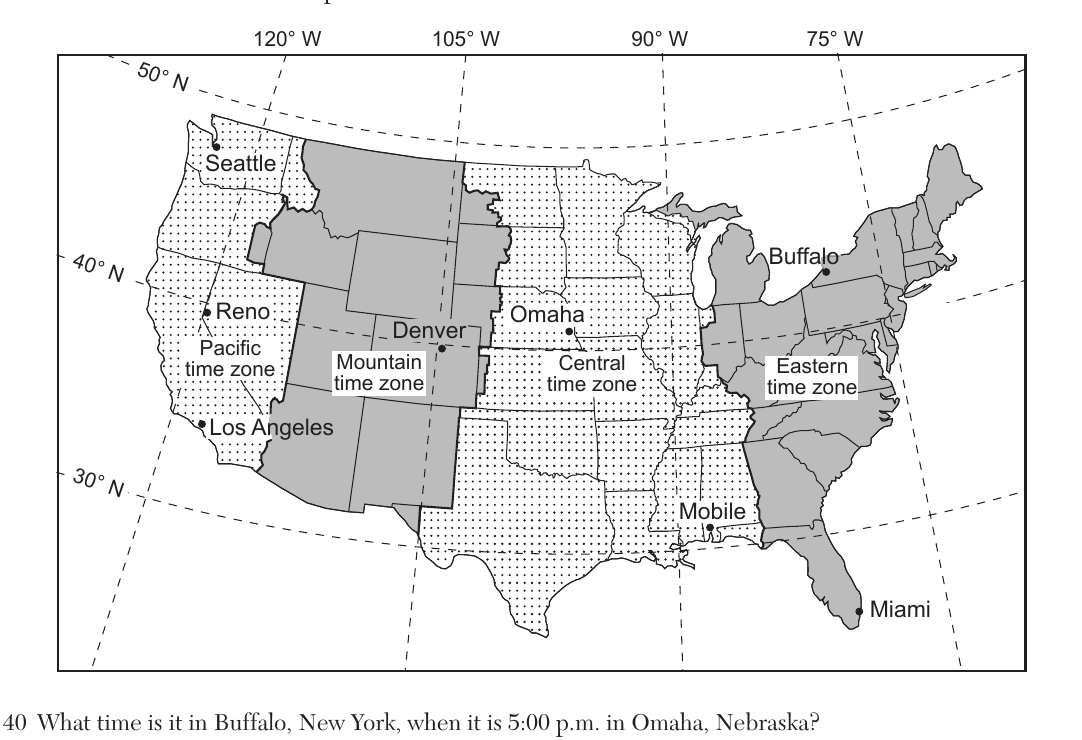
Base your answers on the map showing the four time zones and some latitude and longitude lines across the continental United States, with cities Mobile, Omaha, Miami, and Seattle labeled at different latitudes. Which city has the shortest duration of insolation on December 21?
- (A) Mobile
- (B) Omaha
- (C) Miami
- (D) Seattle ✓
Worked solution
On the December solstice, Northern Hemisphere locations farther north have shorter daylight duration; Seattle, being the northernmost of the listed cities, has the shortest period of insolation.
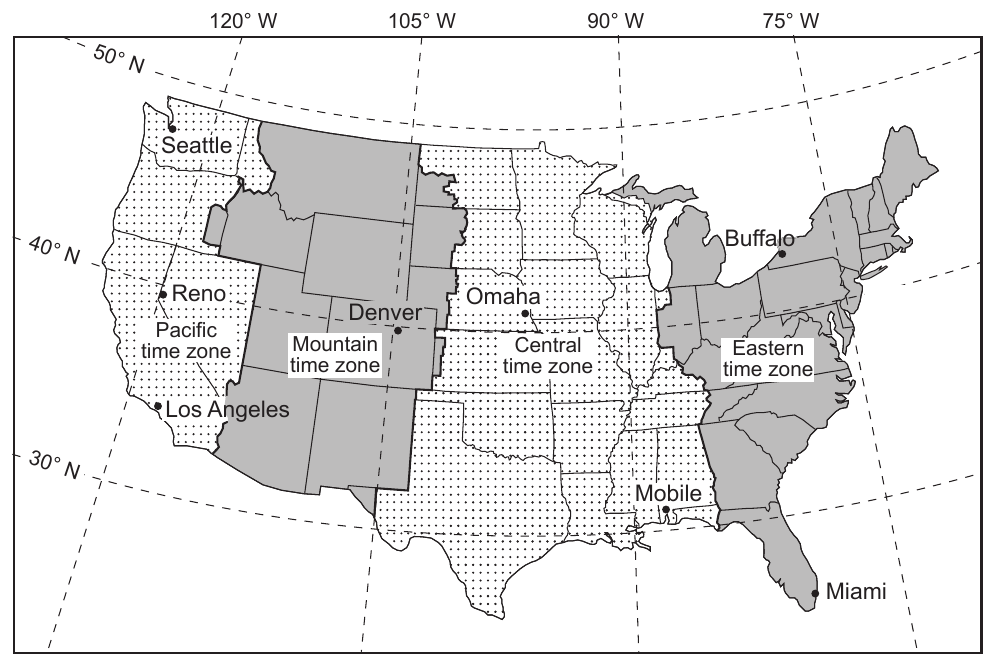
Base your answers on the map showing the four time zones and some latitude and longitude lines across the continental United States. The four time zones shown on the map are based on Earth's
- (A) tilted axis
- (B) orbital velocity
- (C) rate of rotation ✓
- (D) rate of revolution
Worked solution
Time zones are established based on Earth's rotation rate of 15 degrees of longitude per hour, dividing the globe into 24 standard time zones.
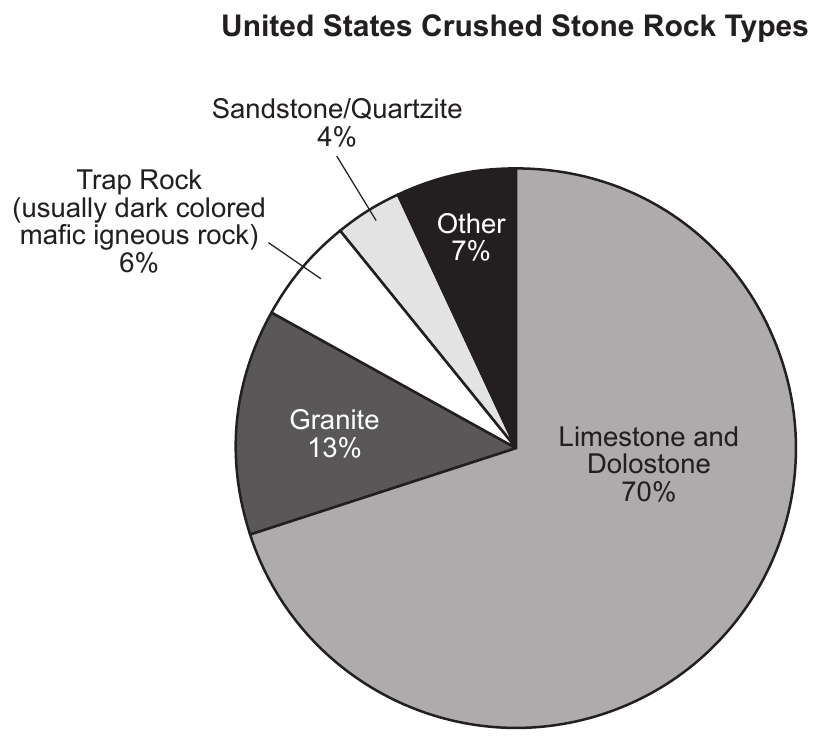
Base your answers on the information and pie chart below. The pie chart shows percentages of different rock types used to make crushed stone in the United States during 2017. Crushed Stone Crushed stone is the world's most basic mineral commodity. It is abundant, widely available, and inexpensive. In 2017, the United States produced 1.3 billion tons of crushed stone, most of which is used in highway and building construction. United States Crushed Stone Rock Types (pie chart): Limestone and Dolostone 70%, Granite 13%, Trap Rock (usually dark colored mafic igneous rock) 6%, Sandstone/Quartzite 4%, Other 7%. Which two elements are common to both rocks that make up the 4% section of the United States crushed stone rock types?
- (A) aluminum and iron
- (B) silicon and oxygen ✓
- (C) calcium and magnesium
- (D) nitrogen and potassium
Worked solution
The 4% section represents sandstone and quartzite, both of which are composed primarily of the mineral quartz (SiO2), so silicon and oxygen are common to both rocks.
Which rock would most likely be included in trap rock?
- (A) phyllite
- (B) obsidian
- (C) diabase ✓
- (D) rhyolite
Worked solution
Trap rock is a dark, mafic igneous rock, and diabase is the mafic intrusive rock among the choices that matches that composition and color.
Which crushed rock would most likely weather the fastest in areas that receive high levels of acidic rain?
- (A) trap rock
- (B) granite
- (C) quartzite
- (D) limestone ✓
Worked solution
Limestone's calcite mineral content reacts readily with acids, so it chemically weathers much faster than silicate rocks like granite, trap rock, or quartzite when exposed to acid rain.
When the driver of a dump truck raises the bed of the dump truck to release its load, quartzite tends to scratch the bottom and sides of the bed easier than limestone. Which property of the minerals in quartzite causes them to more easily scratch the bed of the dump truck?
- (A) streak
- (B) luster
- (C) hardness ✓
- (D) cleavage
Worked solution
Hardness measures a mineral's resistance to scratching; quartz in quartzite is much harder than the truck bed material or limestone's calcite, so it scratches more easily.
One reason why carbon-14 was used to determine the age of the woolly rhinoceros tooth was because carbon-14
- (A) never completely decays
- (B) has a very long half-life
- (C) can be found in most organic remains ✓
- (D) is easily identified in Carboniferous bedrock
Worked solution
Carbon-14 is present in all organic material because living things continuously take in carbon, so it is well-suited for dating organic remains like a tooth.
Approximately how much of the original uranium-238 is left in the sample of zircon crystals?
The sample of zircon crystals is approximately 4.4 billion years old (one uranium-238 half-life).
- (A) 100%
- (B) 50% ✓
- (C) 25%
- (D) 12.5%
Worked solution
Since the zircon's age of 4.4 billion years is approximately equal to one half-life of uranium-238 (4.5 billion years), about half of the original U-238 remains.
The iridium-enriched sediment layer was deposited at the end of which geological period?
- (A) Permian
- (B) Paleogene
- (C) Quaternary
- (D) Cretaceous ✓
Worked solution
An iridium-enriched layer dated to about 65.5 million years corresponds to the Cretaceous-Paleogene boundary, marking the end of the Cretaceous Period.
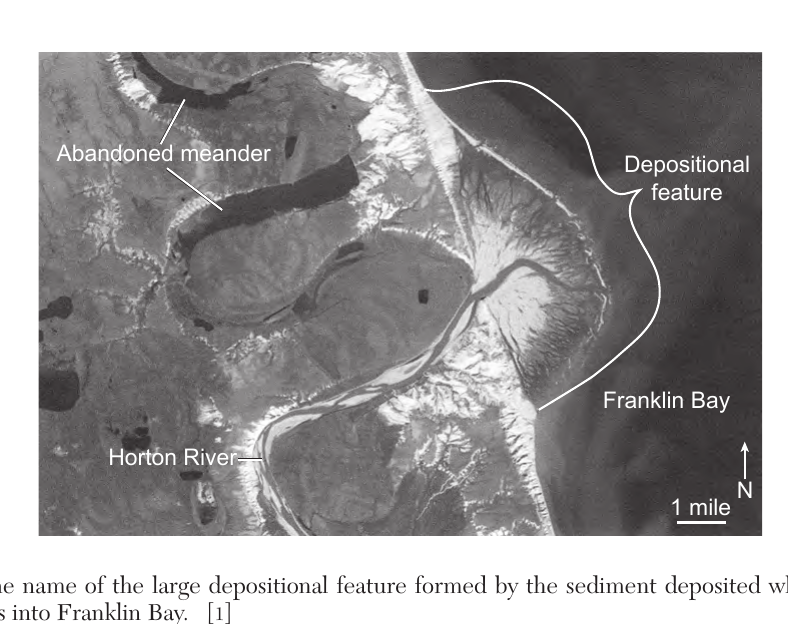
Base your answers to questions 51 through 54 on the satellite image below and on your knowledge of Earth science. The satellite image shows the Horton River flowing into Franklin Bay in northwestern Canada. Large abandoned meanders, now lakes, indicate where the Horton River once flowed before it changed its path over time. Identify the name of the large depositional feature formed by the sediment deposited where the Horton River flows into Franklin Bay.
Worked solution
A delta forms where a river's velocity decreases as it enters a body of standing water, causing it to deposit its sediment load at its mouth.
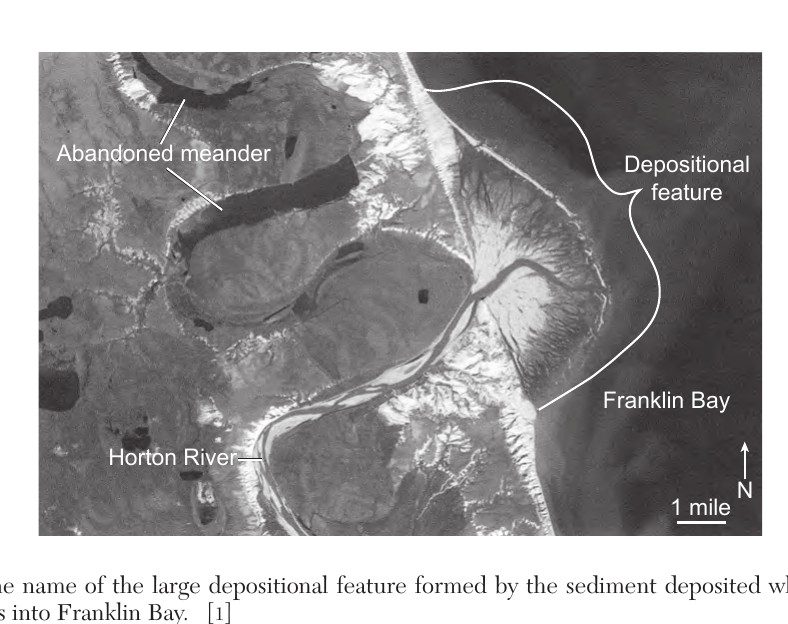
State the general relationship between the distance from the shoreline and the average diameters of the rock particles deposited in Franklin Bay.
Worked solution
Sediment sorts by settling velocity: coarser particles settle first near shore, while finer particles are carried farther out, so grain size decreases with distance from shore.
Identify the dominant process that occurs along the outside of a meander curve and the dominant process that occurs along the inside of a meander curve that caused this meandering river to change its path.
The satellite image shows the Horton River flowing into Franklin Bay in northwestern Canada. Large abandoned meanders, now lakes, indicate where the Horton River once flowed before it changed its path over time. Identify the name of the large depositional feature formed by the sediment deposited where the Horton River flows into Franklin Bay.
Worked solution
Faster current on the outside of a meander erodes the bank, while slower current on the inside deposits sediment, gradually shifting the meander and changing the river's course.
Explain how abrasion causes rounding of rock particles as they are transported by the Horton River.
Worked solution
Abrasion is the mechanical wearing down of particles through collision and friction during transport, which removes sharp edges and rounds the particles.
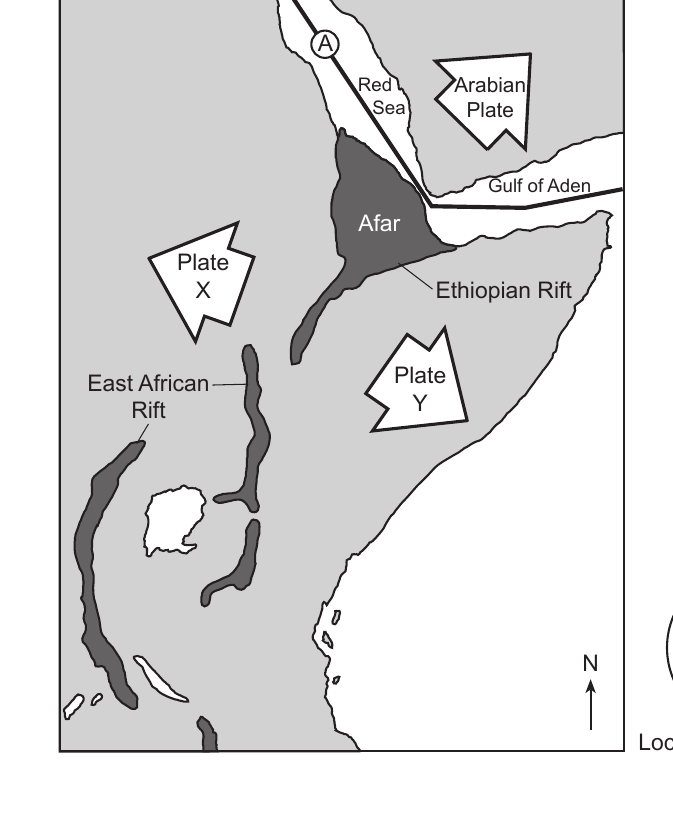
Base your answers to questions 55 through 57 on the passage and map below and on your knowledge of Earth science. The map shows the area of a portion of Africa that includes the Ethiopian Rift and the East African Rift. The large arrows show the directions that the Arabian Plate and the two new plates forming from the African Plate, labeled X and Y, are moving. Letter A represents a plate boundary. East African Rift: The East African Rift System begins at a location where two tectonic plates meet in the Afar region of Africa. The two plates that meet at this location are the Arabian Plate to the north and the African Plate to the south. The African Plate is rifting to form two new plates. The Nubian Plate is moving westward and the Somalian Plate is moving eastward relative to the rift. The rift system began approximately 25 million years ago and now stretches over 3000 kilometers from the Red Sea and Gulf of Aden down toward the southern tip of Africa. The process of rifting is believed to occur due to heat rising from magma below Earth's surface. In 2005, a part of the crust in the Afar region gave way, spreading the rift area by an additional 26 feet. This crack was filled with 600 billion gallons of molten rock, which solidified into basalt. Identify the type of plate boundary at location A.
Worked solution
Location A is where the Red Sea is widening as the Arabian and African Plates move apart, which is the definition of a divergent plate boundary.
Identify the names of the new plates, labeled plate X and plate Y, that are forming from the African Plate.
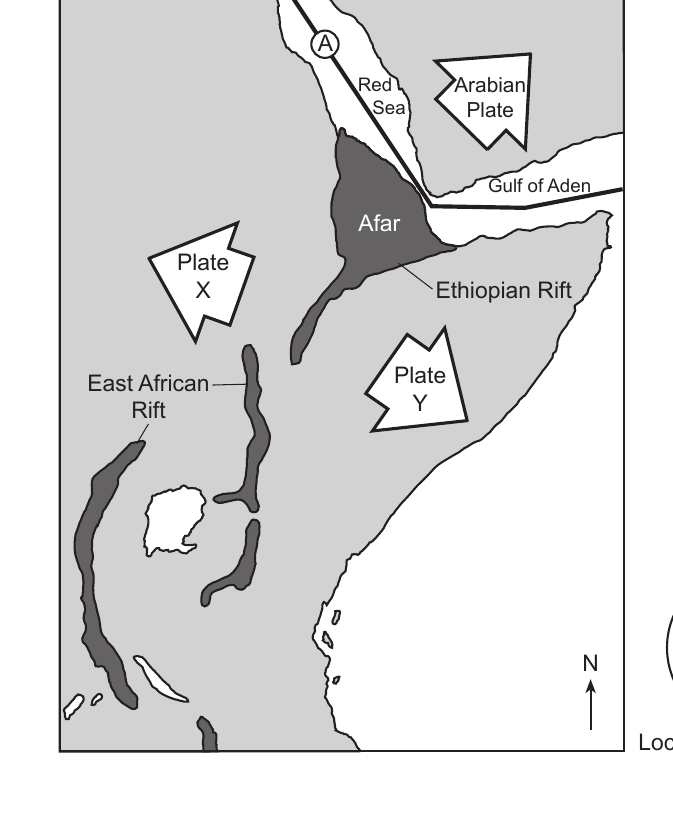
Worked solution
The passage identifies the two new plates by their motion (Nubian moving west, Somalian moving east), which matches the map positions of Plate X (west) and Plate Y (east).
Identify one tectonic event, other than volcanic activity, that is associated with rifting in Africa.
Worked solution
As tectonic plates pull apart during rifting, crustal faulting releases stress as earthquakes, in addition to the volcanic activity from rising magma.
Base your answers to questions 58 and 59 on the isoline map on your answer booklet and on your knowledge of Earth science. The map shows the snowfall totals recorded in inches from a lake effect snowstorm that occurred as a result of cold air passing over the warmer water of Lake Michigan in January 2012. The 2-inch and 8-inch snowfall isolines are shown. On the map in your answer booklet, draw the 4-inch and 6-inch snowfall isolines. Extend both isolines to the top edge of the map.
Worked solution
Isolines of increasing snowfall value must be nested in numerical order without crossing, following the shape of the existing lines, and extended per the instructions.
The air mass that moved over Lake Michigan producing the snowstorm originated in Central Canada. Write the two-letter air mass symbol for this air mass that originated over Canada.
Worked solution
An air mass originating over land in Central Canada is continental and polar in character, giving it the two-letter symbol cP.
Base your answers to questions 60 through 62 on the diagram on your answer booklet and on your knowledge of Earth science. The diagram represents the apparent path of the Sun for a location in New York State on October 21st. Three positions of the Sun are labeled A, B, and C. The length and direction of the shadow of a vertical stick are represented at three different times during the day. Compass directions along the horizon are labeled. On the diagram in your answer booklet, write the letter in each box labeled "Sun position" that caused each of the three shadows.
Sun-path diagram for a New York State location on October 21: The horizon is labeled with compass directions N, E, S, and W. The Sun's apparent path is an arc that begins at the horizon south of due east, reaches its highest point in the southern sky, and ends at the horizon south of due west. Three Sun positions are marked on the arc: A is low in the sky in the southeast (shortly after sunrise), B is at the top of the arc due south (midday), and C is low in the sky in the southwest (shortly before sunset). A vertical stick at the observer's location casts three shadows at three different times, each with a box labeled "Sun position": | Shadow | Length | Direction it points | |---|---|---| | 1 | long | toward the northwest | | 2 | short | due north | | 3 | long | toward the northeast | A shadow points directly away from the Sun, so match each shadow to the Sun position (A, B, or C) that produced it.
Worked solution
Shadow length and direction are determined by the Sun's altitude and azimuth, so each shadow can be matched to the Sun position consistent with that geometry.
On the diagram in your answer booklet, draw the apparent path of the Sun from sunrise to sunset on March 21.
The diagram shows the Sun's apparent path on October 21 for a New York State location: an arc rising at the horizon south of due east, peaking in the southern sky, and setting south of due west. Compass directions N, E, S, and W are labeled on the horizon. Draw (or describe) the March 21 path relative to this October 21 path: where it rises, where it sets, and how high it arcs compared to the October path.
Worked solution
At an equinox the Sun rises due east, sets due west, and follows an arc with noon altitude midway between the solstice extremes, producing 12 hours of daylight.
Identify the letter of the Sun's position where it is closest to solar noon. State one piece of evidence shown in the diagram that supports your answer.
Sun-path diagram for New York State on October 21: Sun position A is low in the southeastern sky (morning), position B is at the highest point of the arc due south, and position C is low in the southwestern sky (afternoon). The vertical stick's three shadows are: a long shadow pointing northwest, the shortest shadow pointing due north, and a long shadow pointing northeast.
Worked solution
Solar noon corresponds to the Sun's maximum daily altitude, which produces the shortest shadow of the day, pointing due north in the Northern Hemisphere midlatitudes.
Base your answers to questions 63 through 65 on the passage below and on your knowledge of Earth science. The passage describes the life cycle of a Sun-like star. The Life Cycle of a Sun-like Star: Stars like the Sun begin as a nebula, which is a large cloud of gas and dust in space. Under the right conditions, a clump in the nebula begins to rotate, contract, and heat up, causing the gas (mainly hydrogen) and dust to glow more brightly. This protostar, or early star, may reach a surface temperature of 3000 K with a luminosity 10 times greater than the Sun. As the protostar continues to collapse, heat and pressure in its core become so great that nuclear reactions begin to use the hydrogen as fuel to produce energy, and the protostar becomes a star. The pressure created by nuclear reactions in the star's core pushes outward and exactly balances the inward pull of gravity. This balance between forces allows the star to maintain a certain size and brightness for about 80% of its life. The star may reach a surface temperature of 5500 K and a luminosity equal to the Sun. After most of the hydrogen in the core is used up, a series of changes first causes the star to collapse, then greatly expand beyond its original size as the surface temperature lowers to 3000 K and the luminosity increases to 2000 times greater than the Sun. As the star reaches the end of its supply of nuclear fuel, its size changes to an equatorial diameter similar to the size of Earth. The surface temperature will be approximately 13,000 K and the luminosity will decrease to 0.001 that of the Sun. In your answer booklet, complete the table by matching the stage of star development listed below to its description. Each stage will be used only once. (Giant, Main Sequence, Nebula, Protostar, White Dwarf)
Complete the table by writing one stage next to each description (each stage used once: Giant, Main Sequence, Nebula, Protostar, White Dwarf): | Description | Stage of Star Development | |---|---| | Large cloud of gas and dust in space | ____ | | Surface temperature of 3000 K and luminosity 10 times greater than the Sun | ____ | | Surface temperature of 5500 K and luminosity equal to the Sun | ____ | | Surface temperature of 3000 K and luminosity 2000 times greater than the Sun | ____ | | Surface temperature of about 13,000 K, luminosity 0.001 that of the Sun, and equatorial diameter similar to Earth | ____ |
Worked solution
The passage describes the stages of stellar evolution in chronological order, and each stage's temperature/luminosity/size data uniquely identifies it as Nebula, Protostar, Main Sequence, Giant, or White Dwarf.
Identify the force responsible for the contraction of gas and dust within a nebula.
Worked solution
Gravity is the attractive force that pulls the gas and dust in a nebula together, causing it to contract and eventually form a protostar.
State the name of the gas that fuels the nuclear process in the core of a star for 80% of its life.
Worked solution
Hydrogen is the fuel used in nuclear fusion reactions in a star's core during its main-sequence stage, which lasts about 80% of its life.
Base your answers to questions 66 through 68 on the passage and map below and on your knowledge of Earth science. The lines on the map show the average locations of the Intertropical Convergence Zone (ITCZ) in January and July. ITCZ: The Intertropical Convergence Zone (ITCZ) is a band of low atmospheric pressure where prevailing winds generally blow toward the equator and come together. As the Sun's direct rays move northward from the equator after the Northern Hemisphere's spring equinox, the ITCZ also moves northward. As the Sun's direct rays move southward from the equator after the Northern Hemisphere's autumnal equinox, the ITCZ also moves southward. This northward and southward movement shifts a greater distance over land than over water. Explain why the Intertropical Convergence Zone shifts northward after the Northern Hemisphere's spring equinox.
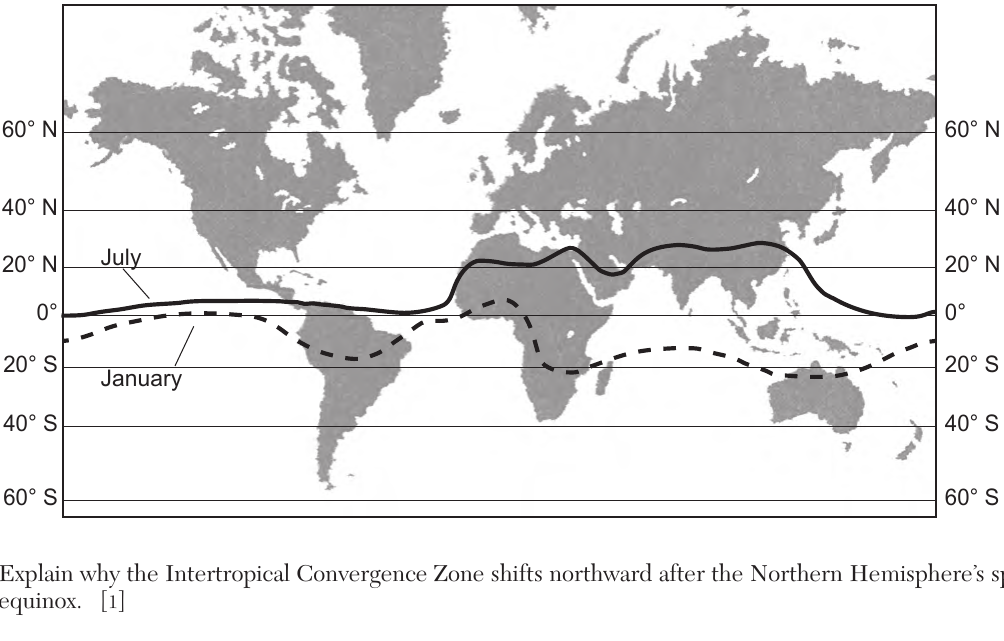
Worked solution
The ITCZ tracks the latitude of the Sun's most direct rays because that is where surface heating and rising air are strongest; after the spring equinox those rays move north, so the ITCZ follows.
Base your answer on the passage and map below and on your knowledge of Earth science. The lines on the map show the average locations of the Intertropical Convergence Zone (ITCZ) in January and July. ITCZ The Intertropical Convergence Zone (ITCZ) is a band of low atmospheric pressure where prevailing winds generally blow toward the equator and come together. As the Sun's direct rays move northward from the equator after the Northern Hemisphere's spring equinox, the ITCZ also moves northward. As the Sun's direct rays move southward from the equator after the Northern Hemisphere's autumnal equinox, the ITCZ also moves southward. This northward and southward movement shifts a greater distance over land than over water. Use the map to identify the maximum latitude that the Intertropical Convergence Zone reached when it shifted farthest north in July and the maximum latitude that it reached when it shifted farthest south in January.
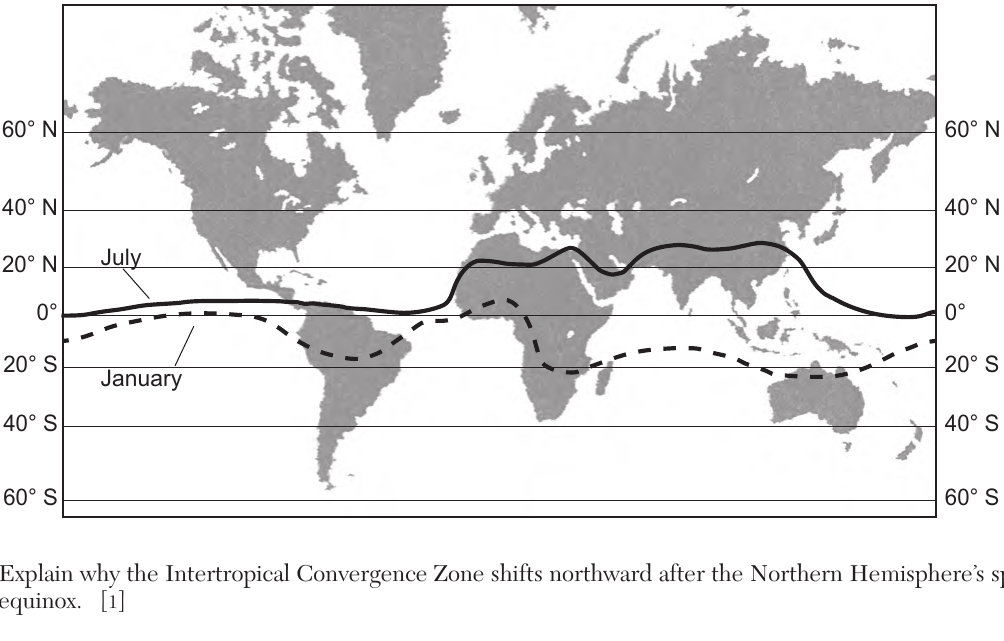
Worked solution
The ITCZ migrates with the Sun's direct rays; because land heats and cools faster than water, its northward and southward swing is exaggerated over continents, producing peaks near 25°N in July and around 20-25°S in January.
Base your answers to questions 66 through 68 on the passage and map (ITCZ) described above. 68 Explain why air is rising along the Intertropical Convergence Zone.
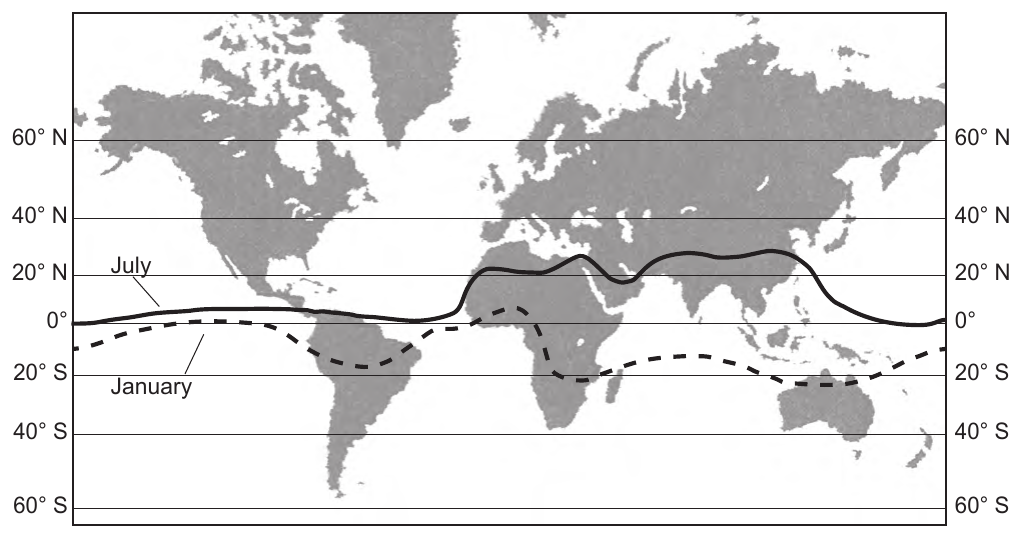
Worked solution
The ITCZ marks where trade winds from both hemispheres converge over strongly heated equatorial land/ocean; the resulting warm air is buoyant and rises, which is why it is a region of low pressure and heavy convective rainfall.
Base your answers to questions 69 through 71 on the diagram on your answer booklet and on your knowledge of Earth science. The diagram represents a satellite in four positions, labeled A through D, in its orbit around a celestial object. 69 The celestial object represents one of the foci of this satellite's elliptical orbit. On the diagram in your answer booklet, draw an X to represent the position of the other focus of this orbit.
The diagram shows an elongated elliptical orbit around a celestial object. The celestial object is located at one focus, on the major axis to one side of the ellipse's center. Four satellite positions are marked on the orbit: A is at the end of the major axis nearest the celestial object, C is at the opposite end of the major axis farthest from the celestial object, and B and D are at opposite ends of the minor axis. The second focus lies on the major axis on the other side of the center, the same distance from the center as the celestial object.
Worked solution
Every ellipse has two foci equidistant from its center along the major axis; since the celestial object occupies one focus, the second focus (X) must lie the same distance from the center on the opposite side.
Base your answers to questions 69 through 71 on the diagram on your answer booklet described above. 70 Describe what would happen to the shape of the orbit represented in the diagram if the two foci were close together.
Worked solution
Orbital eccentricity depends on how far apart the two foci are relative to the major axis; foci close together give a low eccentricity, meaning a more circular orbit.
Base your answers to questions 69 through 71 on the diagram on your answer booklet described above. 71 Identify the letter of the position where the satellite experiences the greatest amount of gravitational attraction with the celestial object. Explain why the greatest amount of gravitational attraction occurs at this position.
The elliptical orbit diagram shows the celestial object at one focus. Satellite position A is at the end of the major axis nearest the celestial object, C is at the far end of the major axis farthest from the object, and B and D are at opposite ends of the minor axis (intermediate distances).
Worked solution
Gravitational force is inversely proportional to the square of the distance between two bodies, so the satellite feels the strongest pull at the point in its orbit where it is physically closest to the celestial object.
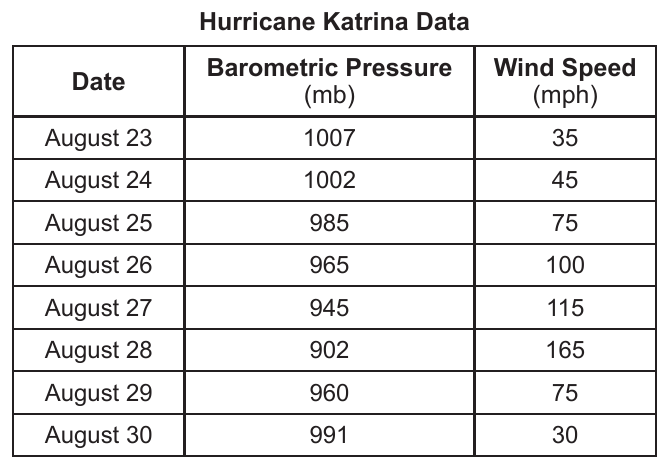
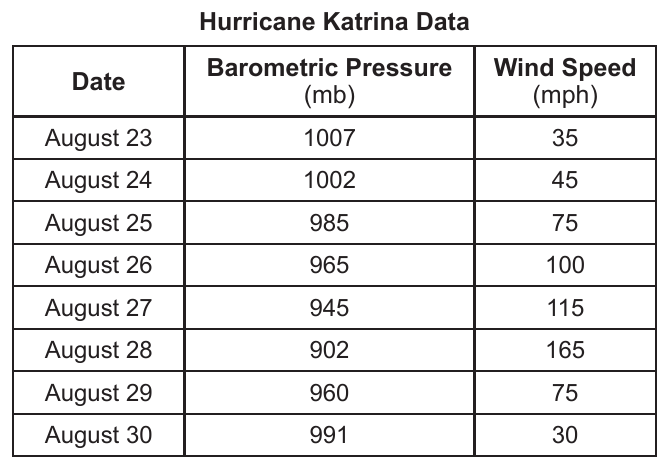
Base your answers to questions 72 through 74 on the data table below and on your knowledge of Earth science. The data table shows the barometric pressure at the center of Hurricane Katrina and the wind speed recorded at the same time each day from August 23 through August 30, 2005. Hurricane Katrina Data | Date | Barometric Pressure (mb) | Wind Speed (mph) | | --- | --- | --- | | August 23 | 1007 | 35 | | August 24 | 1002 | 45 | | August 25 | 985 | 75 | | August 26 | 965 | 100 | | August 27 | 945 | 115 | | August 28 | 902 | 165 | | August 29 | 960 | 75 | | August 30 | 991 | 30 | 72 On the grid in your answer booklet, construct a line graph by plotting the data for the wind speed for each date shown on the data table. Connect all eight plots with a line.
Worked solution
Plotting wind speed against date for all eight recorded days produces a line that increases steadily to a maximum of 165 mph on August 28, then drops rapidly as the storm weakens.
Base your answers to questions 72 through 74 on the Hurricane Katrina data table described above. 73 Hurricane Katrina made landfall on August 29. Describe one piece of evidence shown in the data table that supports this statement.
Worked solution
Hurricanes lose strength (pressure rises, winds slow) once they move over land and are cut off from the warm ocean water that fuels them; the abrupt reversal in both variables on August 29 is direct evidence of landfall.
Base your answers to questions 72 through 74 on the Hurricane Katrina data table described above. 74 Describe the relationship between barometric pressure and wind speed.
Worked solution
A stronger pressure gradient (lower central pressure) drives faster winds toward the storm's center, so pressure and wind speed vary inversely throughout the table.
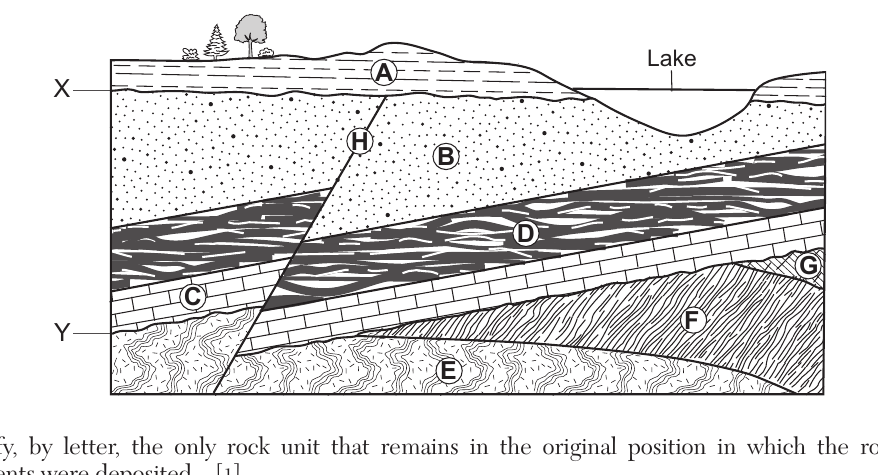
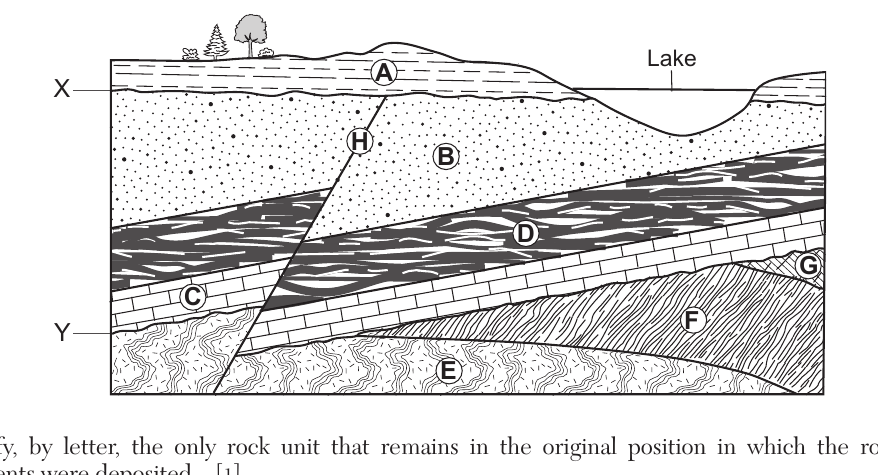
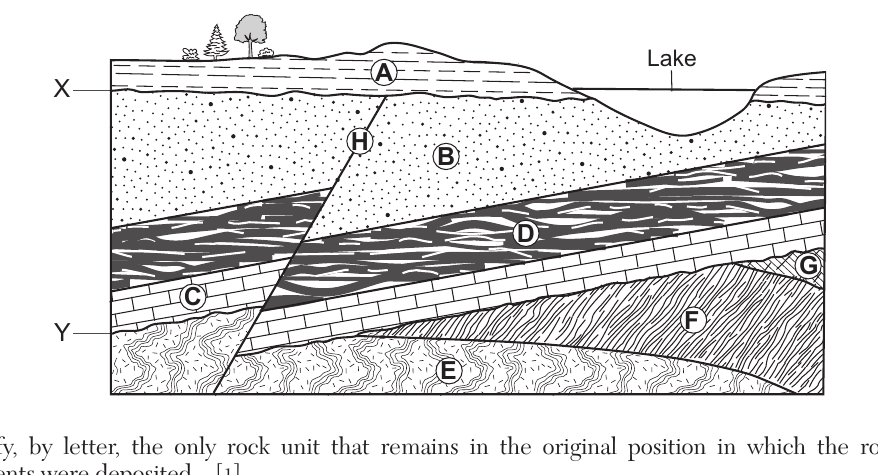
Base your answer on the cross section below and on your knowledge of Earth science. The cross section represents rock units, labeled A through G, and a fault labeled H. Letters X and Y represent unconformities. The rock layers have not been overturned. Identify, by letter, the only rock unit that remains in the original position in which the rock-forming sediments were deposited.
Worked solution
Sediments are originally deposited in horizontal layers; layer A is still flat and undisturbed, while the layers beneath it have been tilted and faulted, so A alone preserves its original position.
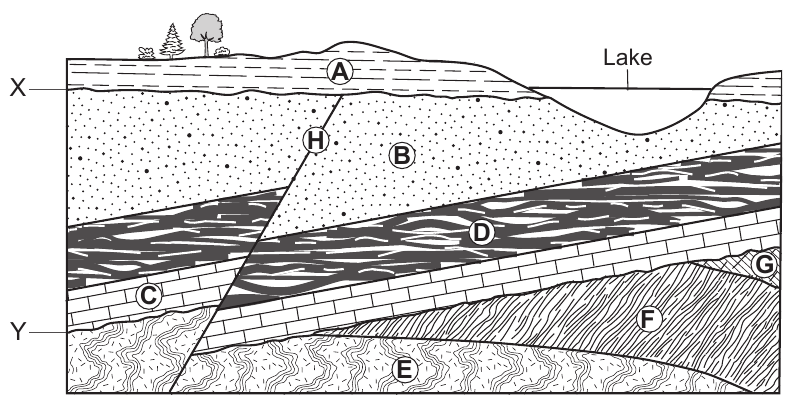
Base your answers to questions 75 through 78 on the cross section described above. 76 Indicate the relative ages of rock layers A, B, C, and D, and fault H by listing the letters from oldest to youngest.
Worked solution
Using superposition for the tilted sequence (C oldest, then D, then B) and cross-cutting relationships (the fault must be younger than every layer it cuts, and layer A must be younger still since it is undisturbed by the fault), the oldest-to-youngest order is C, D, B, H, A.
Base your answers to questions 75 through 78 on the cross section described above. 77 Identify the letter and the name of the rock unit that has a bioclastic texture and is mostly composed of carbon.
Worked solution
According to the Earth Science Reference Tables' rock classification, coal is the organic sedimentary rock with a bioclastic texture that is composed mainly of carbon, matching rock unit G in the diagram.
Base your answers to questions 75 through 78 on the cross section described above. 78 Layer C is Ordovician age bedrock. Identify the name of the trilobite index fossil and the name of the nautiloid index fossil that could be found in rock layer C.
Worked solution
The New York State Earth Science Reference Tables list Triarthrus eatoni as a representative Ordovician trilobite and Endoceras as a representative Ordovician straight-shelled nautiloid (cephalopod), both valid index fossils for Ordovician bedrock.
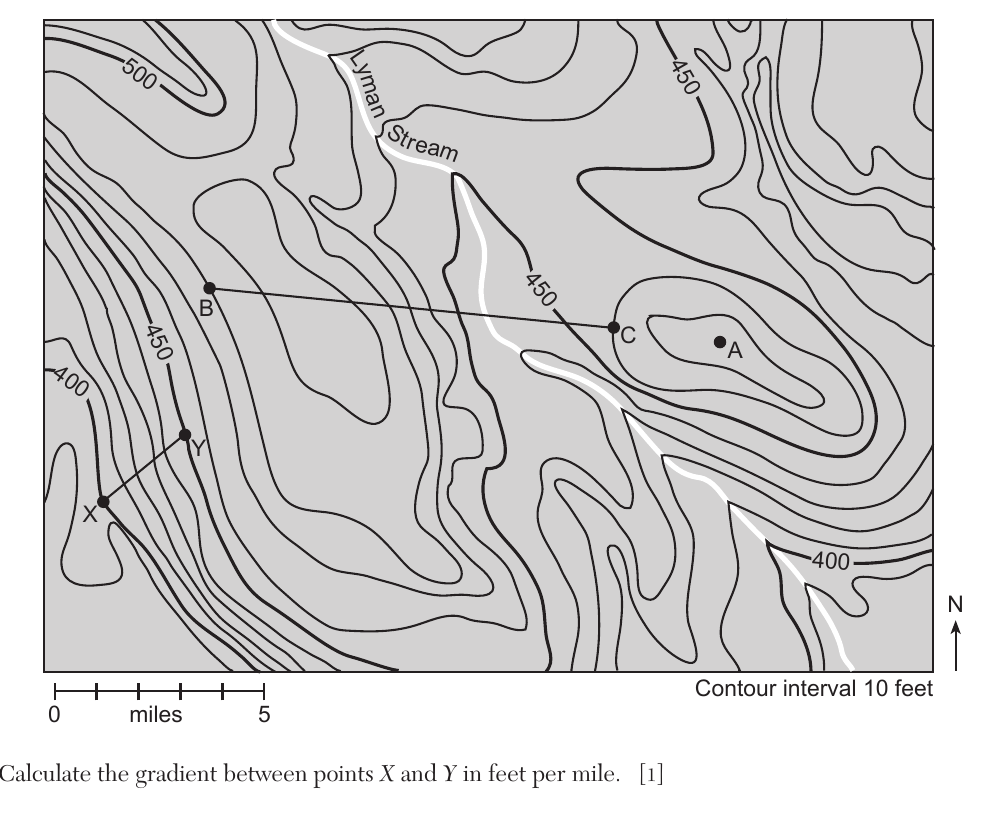
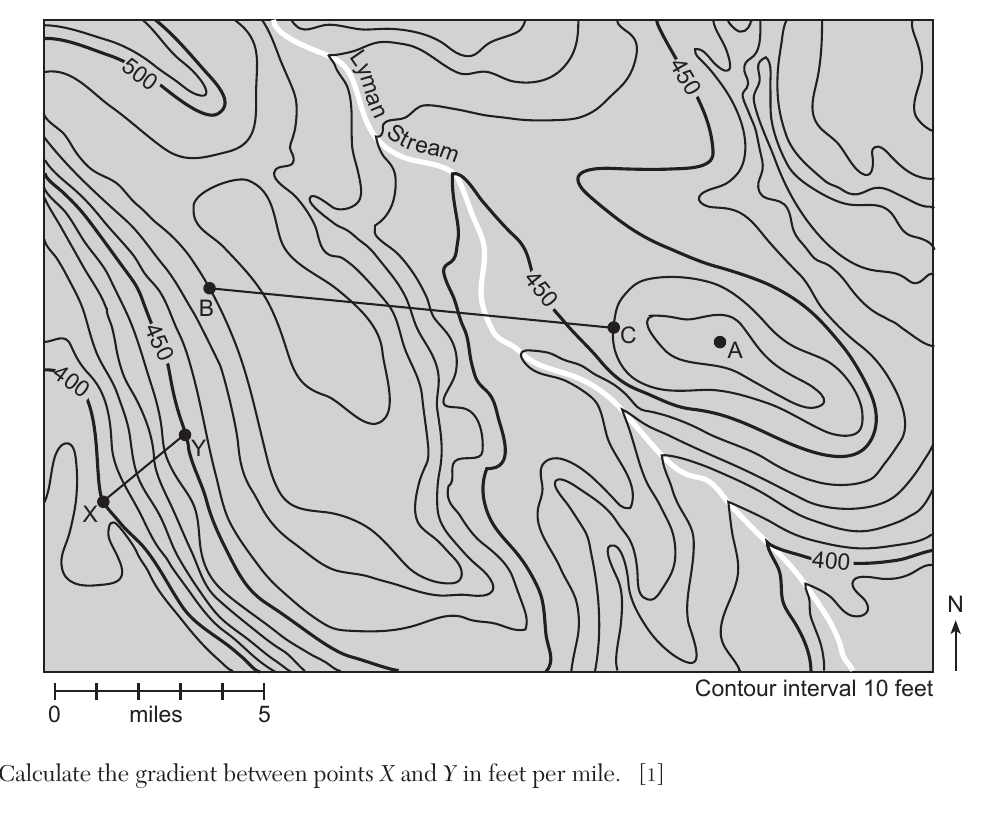
Base your answer on the topographic map below and on your knowledge of Earth science. Letters A, B, C, X, and Y are points on the map. Contour interval is 10 feet. Scale: 0 to 5 miles. Calculate the gradient between points X and Y in feet per mile.
Worked solution
Gradient is found by dividing the difference in elevation between two points by the straight-line map distance between them, measured using the map's bar scale.
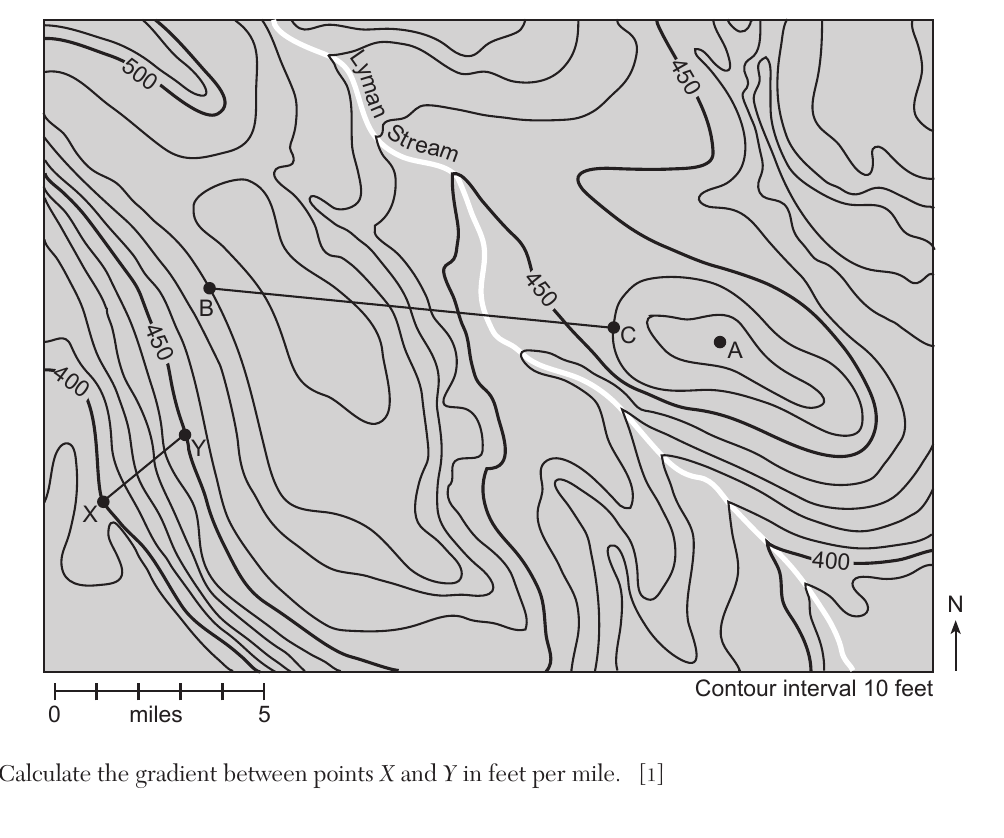
Base your answers to questions 79 through 82 on the topographic map described above. 80 Determine one possible elevation of point A.
Worked solution
Because point A sits inside the innermost closed contour line (450 ft) with no further contour drawn inside it, its true elevation must be somewhere between 450 ft and the next contour interval, 460 ft.
Base your answers to questions 79 through 82 on the topographic map described above. 81 On the grid in your answer booklet, construct a topographic profile along line BC by plotting the elevation of each contour line that crosses line BC. Points B and C have already been plotted on the grid. Connect all nine plots with a line from B to C to complete the profile.
Worked solution
A topographic profile is built by transferring each contour crossing along the chosen transect to an elevation-vs-distance grid in the same left-to-right order as they occur on the map, then connecting the points to show the shape of the land surface.
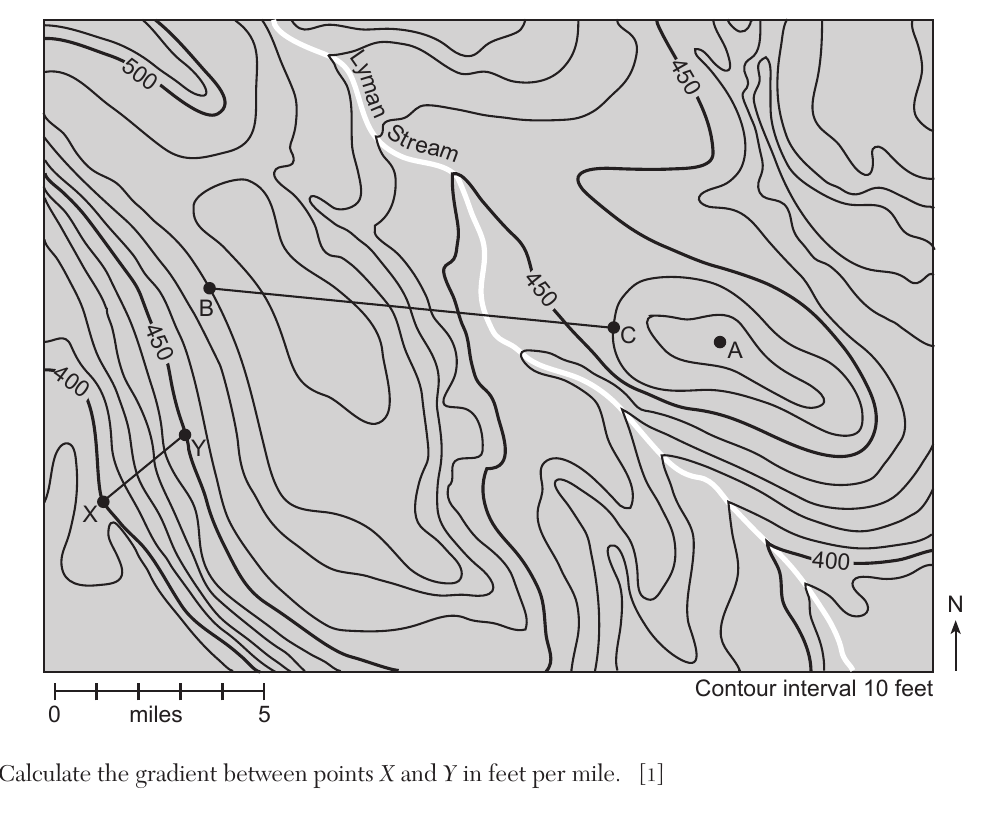
Base your answers to questions 79 through 82 on the topographic map described above. 82 State the general compass direction in which Lyman Stream flows. Describe the evidence shown by the contour lines on the map that supports this stream flowing downhill in that direction.
Worked solution
On a topographic map, contour lines crossing a stream always bend to point in the upstream direction (toward higher ground); since these V-shapes point north along Lyman Stream, the water itself must be flowing south, downhill.
Base your answers to questions 83 through 85 on the diagram on your answer booklet and on your knowledge of Earth science. The diagram represents temperatures that occur on either side of a mountain. Elevations are recorded in meters (m) above sea level and air temperature is recorded in degrees Celsius (°C). Letters A and B represent reference lines on the diagram. 83 On the diagram in your answer booklet, draw one arrowhead on reference line A and one arrowhead on reference line B to indicate the direction of air flow on each side of the mountain.
The diagram is a cross-section of a mountain. Prevailing winds move air toward the mountain from the west (left side). Air rises up the west slope, passes over the summit, and descends the east slope. Reference line A runs parallel to the west slope and reference line B runs parallel to the east slope. Air temperatures marked on the diagram decrease with elevation going up the west side; at equal elevations the descending air on the east side is warmer than the air on the west side, because the rising air cools and loses moisture (clouds and precipitation on the windward side) while the sinking air on the leeward side warms by compression.
Worked solution
In an orographic circulation, air is forced to rise on the windward side of a mountain and, having lost most of its moisture, descends and warms on the leeward side, so the arrowheads must point upslope on A and downslope on B.
Base your answers to questions 83 through 85 on the mountain diagram described above. 84 Compared to the air temperature and moisture conditions on the western side of the mountain at sea level, describe how the air temperature and moisture conditions on the eastern side of the mountain at sea level are different.
The diagram is a cross-section of a mountain. Prevailing winds move air toward the mountain from the west (left side). Air rises up the west slope, passes over the summit, and descends the east slope. Reference line A runs parallel to the west slope and reference line B runs parallel to the east slope. Air temperatures marked on the diagram decrease with elevation going up the west side; at equal elevations the descending air on the east side is warmer than the air on the west side, because the rising air cools and loses moisture (clouds and precipitation on the windward side) while the sinking air on the leeward side warms by compression.
Worked solution
This is the classic orographic/rain-shadow effect: moist air loses its water vapor while rising and cooling on the windward slope, then the now-dry air warms adiabatically as it sinks on the leeward slope, leaving the eastern base warmer and drier than the western base.
Base your answers to questions 83 through 85 on the mountain diagram described above. 85 State the most probable air temperature that would occur on the west side of the mountain at 1500 meters and the most probable air temperature on the east side of the mountain at 1500 meters.
Worked solution
Rising saturated air cools more slowly (wet adiabatic rate, about 0.6°C/100 m) because condensation releases latent heat, while descending dry air on the leeward side warms faster (dry adiabatic rate, about 1°C/100 m), so at the same elevation the leeward-side air is warmer than the windward-side air.