January 2025 Earth Science Regents — Answer Key & Worked Solutions
Every question from the January 2025 Earth Science Regents exam, with the correct answer and a full step-by-step solution. Check your work, learn the method, then convert your raw score.
These are real questions from the January 2025 Earth Science New York State Regents examination, published by NYSED. Worked solutions are written by RegentsLab.
Ceres, a dwarf planet, is located approximately 413 million kilometers from the Sun and is located between the orbits of
- (A) Mercury and Venus
- (B) Earth and Mars
- (C) Mars and Jupiter ✓
- (D) Saturn and Uranus
Worked solution
Ceres is the largest object in the main asteroid belt, which lies between the orbits of Mars and Jupiter, consistent with its distance of about 413 million km from the Sun.
Observations made by astronomers indicate that the light from most galaxies shows a
- (A) red shift because the galaxies are moving toward Earth
- (B) red shift because the galaxies are moving away from Earth ✓
- (C) blue shift because the galaxies are moving toward Earth
- (D) blue shift because the galaxies are moving away from Earth
Worked solution
Most galaxies show a red shift in their light spectra, indicating they are moving away from Earth, which is evidence for an expanding universe.
Compared to the Jovian planets, the terrestrial planets are
- (A) large, gaseous, and of low density
- (B) large, gaseous, and of high density
- (C) small, rocky, and of low density
- (D) small, rocky, and of high density ✓
Worked solution
Terrestrial planets are small, rocky worlds with high density, unlike the large, gaseous, low-density Jovian planets.
The apparent shift in the direction of the swing of a Foucault pendulum is a direct result of the
- (A) inclination of Earth's axis
- (B) spinning of Earth on its axis ✓
- (C) orbiting of Earth around the Sun
- (D) distance between Earth and the Sun
Worked solution
A Foucault pendulum appears to change its swing direction because Earth is rotating on its axis beneath the pendulum's fixed plane of motion.
Which motion causes some constellations to be visible in New York State only during winter nights and other constellations to be visible only during summer nights?
- (A) rotation of Earth on its axis
- (B) revolution of Earth around the Sun ✓
- (C) rotation of the constellations around Earth
- (D) revolution of the constellations around the Sun
Worked solution
As Earth revolves around the Sun, different portions of the night sky face Earth's dark side in different seasons, so different constellations become visible in winter versus summer.
Which set of New York State locations would have the greatest difference in the altitude of Polaris observed in the night sky?
The altitude of Polaris equals the observer's latitude. Approximate latitudes of these New York State locations (from the Generalized Landscape Regions map in the Earth Science Reference Tables): | Location | Approximate Latitude | |---|---| | Niagara Falls | 43.1 deg N | | Albany | 42.7 deg N | | Rochester | 43.2 deg N | | Ithaca | 42.4 deg N | | Riverhead | 40.9 deg N | | Massena | 44.9 deg N | | Plattsburgh | 44.7 deg N | | Jamestown | 42.1 deg N |
- (A) Niagara Falls and Albany
- (B) Rochester and Ithaca
- (C) Riverhead and Massena ✓
- (D) Plattsburgh and Jamestown
Worked solution
The altitude of Polaris above the horizon equals the observer's latitude, so the two NY locations with the greatest latitude difference, Riverhead in the south and Massena in the far north, show the greatest difference in Polaris's altitude.
Which processes of the water cycle allow water vapor to enter the atmosphere?
- (A) condensation and evaporation
- (B) condensation and infiltration
- (C) transpiration and evaporation ✓
- (D) transpiration and infiltration
Worked solution
Evaporation and transpiration both convert liquid water into water vapor and release it into the atmosphere, while condensation and infiltration remove water vapor or move liquid water, respectively.
What is the dewpoint when the dry-bulb temperature is 19°C and the relative humidity is 73%?
- (A) 12°C
- (B) 14°C ✓
- (C) 3°C
- (D) 16°C
Worked solution
Using the ESRT relative humidity and dewpoint tables with a dry-bulb temperature of 19°C and a relative humidity of 73%, the corresponding dewpoint is 14°C.
The diagram below shows a weather station model. The station model shows the number 91 in the upper left, the number 150 in the upper right, the number 80 in the lower left, a half-shaded circle (partly cloudy sky symbol), and wind barbs extending to the lower left. What is the air pressure, in millibars (mb), indicated by this station model?
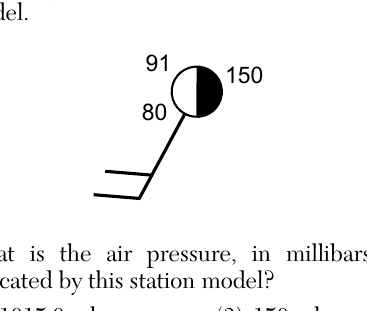
- (A) 1015.0 mb ✓
- (B) 915.0 mb
- (C) 150 mb
- (D) 15.0 mb
Worked solution
Station model pressure codes below 500 are converted by placing a 10 before the number and dividing by 10, so the code 150 represents an actual pressure of 1015.0 mb.
The photograph below was taken by aiming a camera at a portion of the night sky above Albany, New York, for a period of time to record the apparent star motion, resulting in star trails. Which celestial object is located at the center of the star trails?
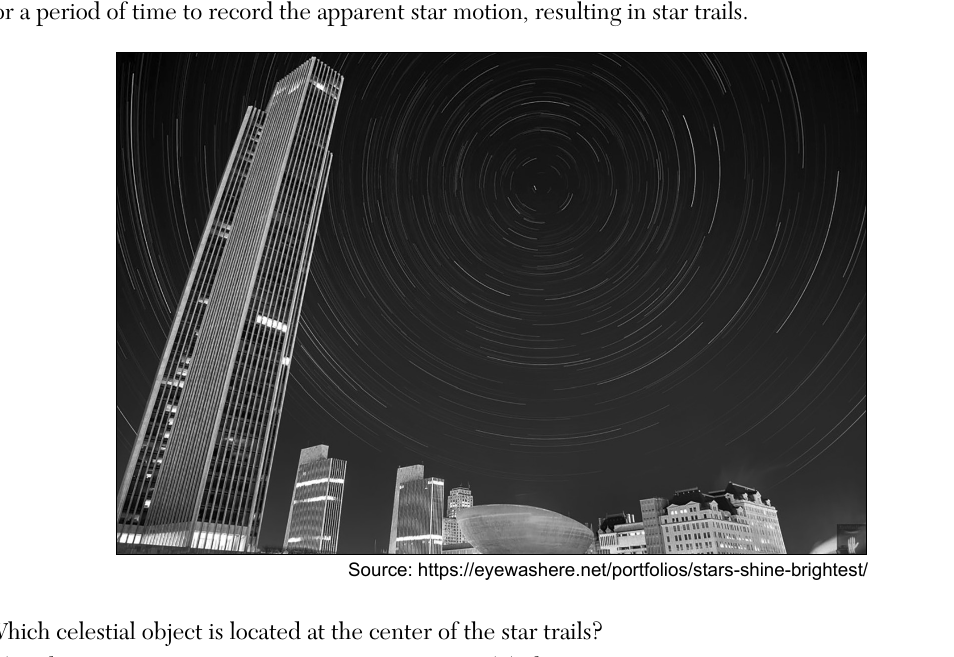
- (A) Polaris ✓
- (B) Alpha Centauri
- (C) the Sun
- (D) the Moon
Worked solution
Because Polaris is located almost directly above Earth's rotational axis (near the north celestial pole), long-exposure photographs of the night sky show other stars tracing circular trails around it.
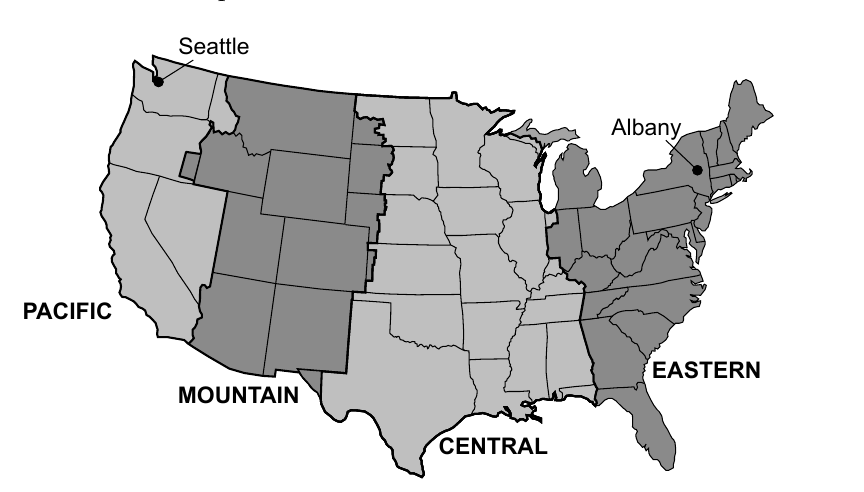
The map below shows the locations of four time zones in the United States (Pacific, Mountain, Central, Eastern). Seattle, Washington, and Albany, New York, are labeled on the map. If the time in Albany, New York, is 10 a.m., what time would it be in Seattle, Washington?
- (A) 1 p.m.
- (B) 12 p.m.
- (C) 8 a.m.
- (D) 7 a.m. ✓
Worked solution
Seattle is in the Pacific time zone, which is three hours behind Albany's Eastern time zone, so 10 a.m. in Albany corresponds to 7 a.m. in Seattle.
Which diagram correctly matches the location of the Sun with the direction of the shadow cast by the stick? Four diagrams (1)-(4) each show a horizon oval labeled with North, East, South, West, a vertical stick standing at the center, a shadow cast from the stick, and the Sun positioned somewhere along an arc above the horizon.
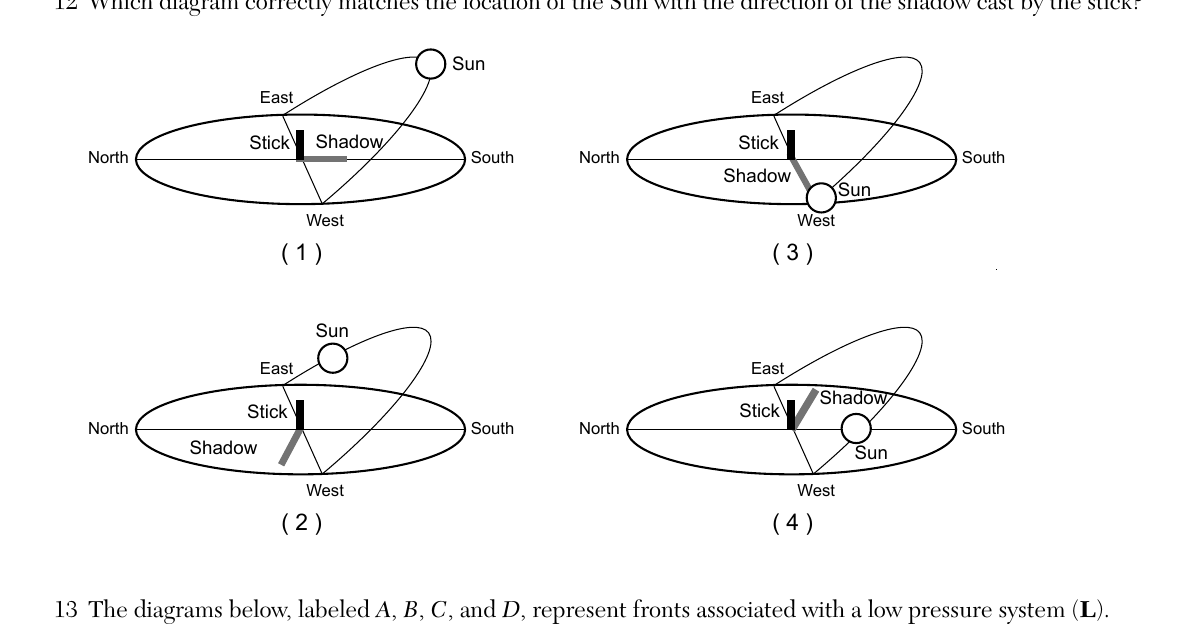
- (A) Diagram 1: Sun positioned in the eastern sky above the horizon; shadow drawn extending toward the west-southwest from the stick
- (B) Diagram 2: Sun positioned low near the eastern horizon; shadow drawn extending toward the west from the stick ✓
- (C) Diagram 3: Sun positioned low near the western horizon; shadow drawn extending toward the east from the stick
- (D) Diagram 4: Sun positioned in the southern sky; shadow drawn extending toward the north from the stick, but the Sun and shadow are on the same side
Worked solution
A shadow always points in the direction opposite the Sun; only the diagram where the shadow's direction is exactly opposite the Sun's position along the horizon (choice 2 per the scoring key) is geometrically consistent.
The diagrams below, labeled A, B, C, and D, represent fronts associated with a low pressure system (L). Each diagram shows a curved front line with either triangle symbols (cold front) or semicircle symbols (warm front) attached at different stages of merging into a single occluded front line. Which sequence best represents the order in the development of an occluded front from a cold front and warm front?
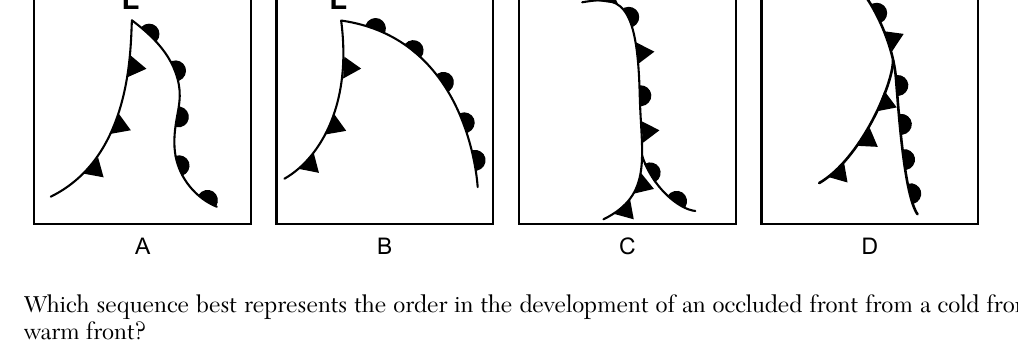
- (A) A, B, C, D
- (B) B, A, D, C ✓
- (C) C, D, A, B
- (D) D, C, B, A
Worked solution
An occluded front develops in stages as the faster-moving cold front catches up with and lifts the warm front; the scoring key confirms the correct progression is diagram B first, then A, then D, then C.
Which map shows the most likely direction of flow of the jet stream and the types of air masses found on either side? Four maps of the United States are shown, each with a jet stream (a wavy band) crossing the country and labels 'Warm' and 'Cold' on either side, with arrows indicating flow direction.
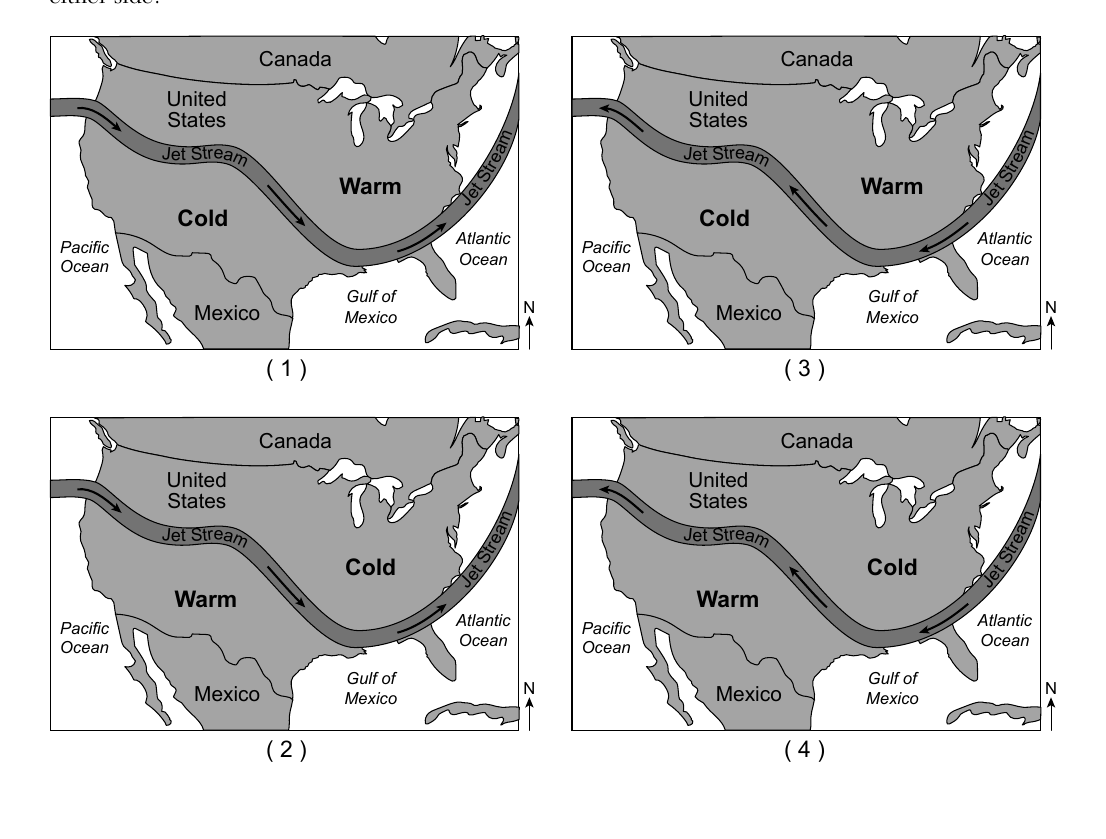
- (A) Map 1: jet stream flows from the Atlantic Ocean toward the Pacific Ocean; Warm labeled north, Cold labeled south
- (B) Map 2: jet stream flows from the Pacific Ocean toward the Atlantic Ocean; Cold labeled north, Warm labeled south ✓
- (C) Map 3: jet stream flows from the Atlantic Ocean toward the Pacific Ocean; Warm labeled south, Cold labeled north
- (D) Map 4: jet stream flows from the Pacific Ocean toward the Atlantic Ocean; Cold labeled south, Warm labeled north
Worked solution
The polar jet stream typically flows west to east (Pacific to Atlantic) across the United States, separating colder air to the north from warmer air to the south, matching Map 2 as confirmed by the scoring key.
Which statement best explains why predictions for extreme weather events are more accurate today than in the past?
- (A) There are fewer extreme weather events occurring now.
- (B) Scientists control weather by using technology.
- (C) Weather conditions change more slowly now than in the past.
- (D) Advanced computer models use weather data to make predictions. ✓
Worked solution
Modern forecasting accuracy has improved mainly because advanced computer models can process large amounts of weather data to generate more reliable predictions.
In order to maximize the amount of insolation absorbed by a roof in a colder climate, roofing materials should be
- (A) dark-colored and rough-textured ✓
- (B) dark-colored and smooth-textured
- (C) light-colored and rough-textured
- (D) light-colored and smooth-textured
Worked solution
Dark-colored, rough-textured surfaces absorb the most insolation because dark colors reduce reflection and rough textures scatter and trap incoming radiation, ideal for maximizing heat absorption in a colder climate.
Uneven heating of Earth's surface and atmosphere, along with the Coriolis Effect, produces ocean currents with a general
- (A) clockwise flow in both northern and southern hemispheres
- (B) counterclockwise flow in both northern and southern hemispheres
- (C) clockwise flow in the northern hemisphere and counterclockwise flow in the southern hemisphere ✓
- (D) counterclockwise flow in the northern hemisphere and clockwise flow in the southern hemisphere
Worked solution
The Coriolis Effect deflects ocean currents to the right in the Northern Hemisphere and to the left in the Southern Hemisphere, producing clockwise gyres in the north and counterclockwise gyres in the south.
Which human activity contributes to the high levels of greenhouse gases in Earth's atmosphere?
- (A) burning fossil fuels ✓
- (B) watering farm crops
- (C) using solar energy
- (D) replanting forests
Worked solution
Burning fossil fuels releases large amounts of carbon dioxide, a major greenhouse gas, directly increasing atmospheric greenhouse gas levels.
What is the main reason that locations near oceans have smaller annual temperature ranges than locations inland at the same latitude?
- (A) Oceans have a lower elevation than land.
- (B) Oceans cover a greater percentage of Earth's surface.
- (C) Water has a lower density than land.
- (D) Water has a higher specific heat than land. ✓
Worked solution
Water's higher specific heat means it heats up and cools down more slowly than land, moderating temperatures near oceans and producing smaller annual temperature ranges compared to inland areas.
The division of geologic time into eras, periods, and epochs is based primarily on
- (A) celestial events
- (B) tectonic events
- (C) the absolute age of rocks
- (D) the fossil record ✓
Worked solution
Geologic time is divided into eras, periods, and epochs based primarily on major changes observed in the fossil record, such as mass extinctions and the appearance of new life forms.
During which geologic time period were thick layers of evaporites deposited in New York State?
- (A) Triassic
- (B) Permian
- (C) Silurian ✓
- (D) Pennsylvanian
Worked solution
According to the geologic history of New York State, thick evaporite deposits such as rock salt and gypsum formed during the Silurian Period when shallow seas evaporated.
Earth's outer core is inferred to be a liquid because
- (A) P-waves cannot travel through it
- (B) S-waves cannot travel through it ✓
- (C) P-waves travel faster than S-waves through it
- (D) S-waves travel faster than P-waves through it
Worked solution
S-waves cannot travel through liquids, and since S-waves do not pass through Earth's outer core, this is used as evidence that the outer core is liquid.
A seismograph detects an earthquake that occurred 5600 km away. The P-waves arrived at 10:36:00 a.m. What time did the earthquake occur?
- (A) 09:00:00 a.m.
- (B) 10:19:50 a.m.
- (C) 10:27:00 a.m. ✓
- (D) 10:45:00 a.m.
Worked solution
The earthquake's origin time is found by subtracting the P-wave travel time (read from the reference tables travel-time graph for a 5600 km distance, about 9 minutes) from the arrival time of the P-waves.
The Mariana Trench has formed because the Pacific Plate is
- (A) overriding the Philippine Plate
- (B) overriding the Indian-Australian Plate
- (C) subducting beneath the Philippine Plate ✓
- (D) subducting beneath the Indian-Australian Plate
Worked solution
Deep ocean trenches like the Mariana Trench form where one oceanic plate subducts beneath another; here the Pacific Plate is subducting beneath the Philippine Plate.
Rock primarily composed of which mineral would be most resistant to physical weathering?
- (A) calcite
- (B) gypsum
- (C) halite
- (D) olivine ✓
Worked solution
Physical weathering resistance increases with mineral hardness; olivine is by far the hardest of the choices listed, making it the most resistant to physical weathering.
Which agent of erosion produces parallel scratches and grooves in surface bedrock?
- (A) glacier ✓
- (B) wind
- (C) running water
- (D) ocean waves
Worked solution
As a glacier moves, rock fragments frozen in its base scrape across the underlying bedrock, carving parallel scratches and grooves called striations.
The map below shows the prevailing wind direction over the Sierra Nevada, a mountain range in California. Letters A and B represent locations on Earth's surface. Compared to the climate at location A, the climate at location B generally is
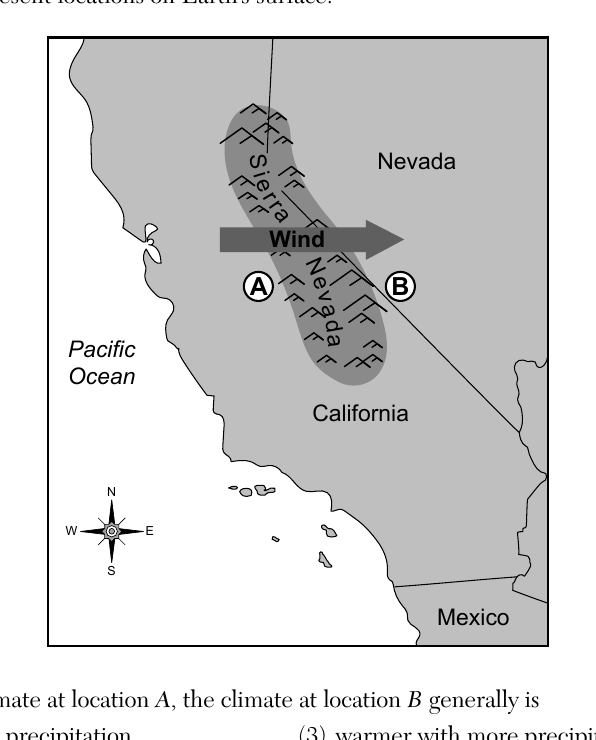
- (A) cooler with more precipitation
- (B) cooler with less precipitation
- (C) warmer with more precipitation
- (D) warmer with less precipitation ✓
Worked solution
Location A sits on the windward (upwind) side of the Sierra Nevada where rising moist air cools and drops precipitation, while location B is on the leeward (downwind) side, where descending air warms and dries, producing a rain-shadow climate that is warmer with less precipitation.
Which pie graph correctly shows the percentage of original radioactive $^{40}K$ remaining in an igneous rock sample after $2.6 \times 10^9$ years? (Key: shaded = $^{40}K$, white = $^{40}Ar$ and $^{40}Ca$)
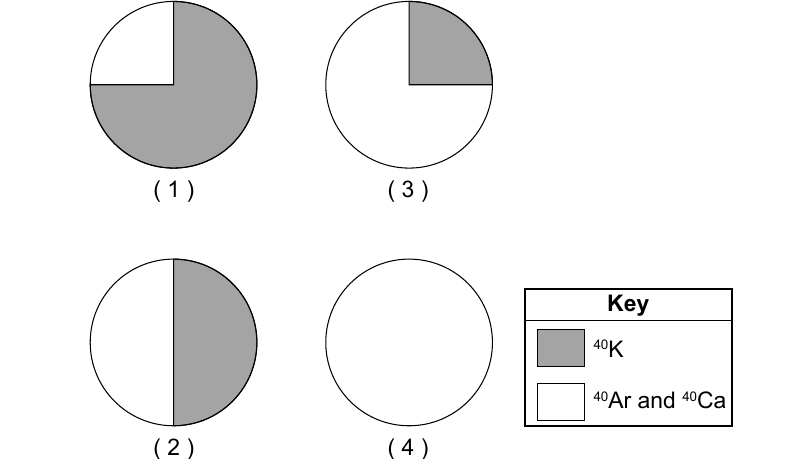
- (A) Pie graph with about three-fourths shaded ($^{40}K$) and one-fourth white ($^{40}Ar$ and $^{40}Ca$)
- (B) Pie graph with half shaded ($^{40}K$) and half white ($^{40}Ar$ and $^{40}Ca$)
- (C) Pie graph with about one-fourth shaded ($^{40}K$) and three-fourths white ($^{40}Ar$ and $^{40}Ca$) ✓
- (D) Pie graph that is entirely white (0% $^{40}K$ remaining)
Worked solution
Since 2.6 billion years equals exactly two half-lives of potassium-40 (1.3 billion years each), only 25% of the original $^{40}K$ remains, matching the pie graph shaded about one-fourth.
The diagram below represents three rock outcrops at locations A, B, and C. No overturning of rock layers has occurred. Which rock unit shown in the three outcrops is the oldest?
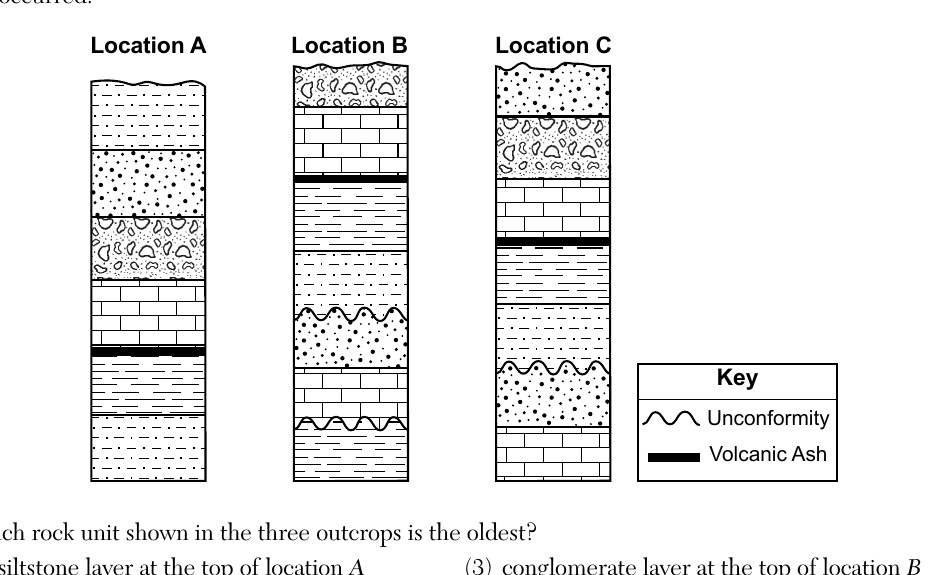
- (A) siltstone layer at the top of location A
- (B) shale layer at the bottom of location B ✓
- (C) conglomerate layer at the top of location B
- (D) limestone layer at the bottom of location C
Worked solution
Using superposition and cross-correlation of marker beds (volcanic ash layers and an unconformity) among the three outcrops, the shale layer at the bottom of location B corresponds to the deepest, and therefore oldest, rock unit among the choices given.
The diagram below represents the magnetic polarity preserved by minerals within the bedrock of the oceanic crust near the Mid-Atlantic Ridge. Letters A, B, C, and D represent locations on the ocean-floor bedrock. The oldest bedrock is found at location
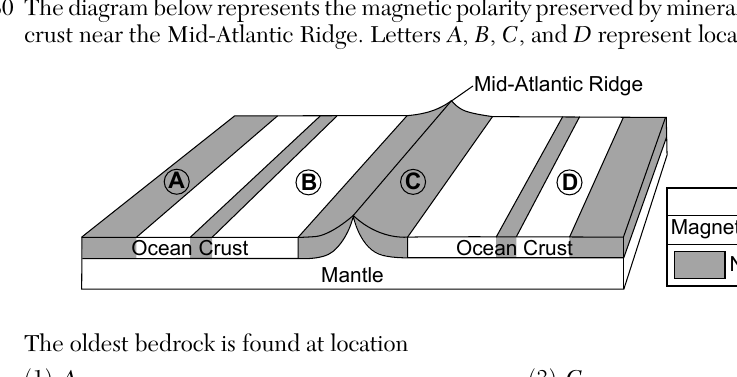
- (A) A ✓
- (B) B
- (C) C
- (D) D
Worked solution
Because new oceanic crust is continuously created at the mid-ocean ridge and pushed outward as seafloor spreading occurs, bedrock farthest from the ridge crest is the oldest; of the labeled points, location A is farthest from the ridge.
Oswego and Old Forge, located at similar latitudes in New York State, have very different landscapes. Which two factors are primarily responsible for these landscape differences?
- (A) soil characteristics and bedrock composition
- (B) soil characteristics and bedrock age
- (C) bedrock structure and bedrock composition ✓
- (D) bedrock structure and bedrock age
Worked solution
New York's landscape regions are determined chiefly by the structure and composition of the local bedrock, which explains why Oswego's lowland and Old Forge's highland landscapes differ despite being at a similar latitude.
The topographic map below shows the location of Henry Creek. Points A, B, C, and D represent locations on Earth's surface. Contour Interval = 10 feet. At which location would the water in Henry Creek be flowing at the greatest rate?
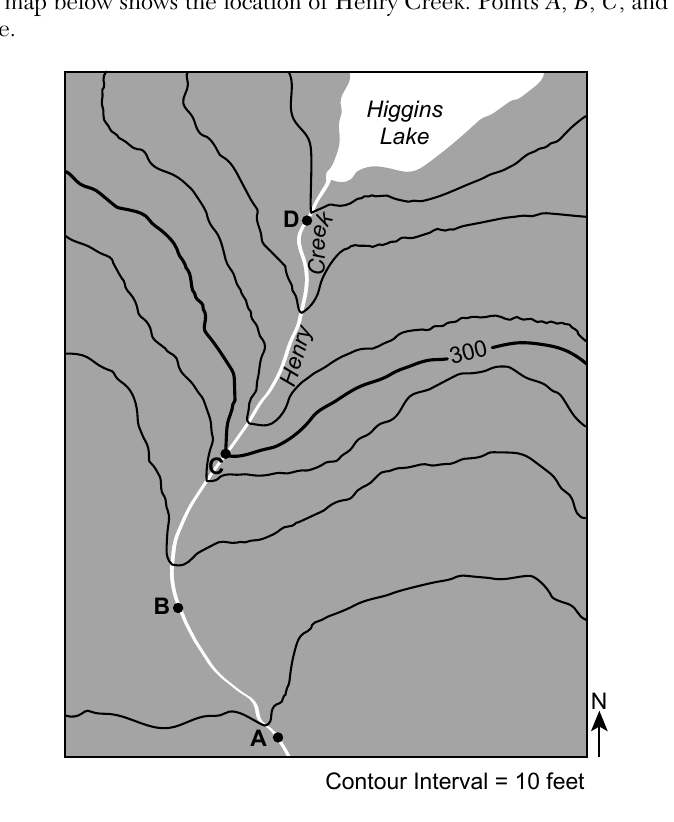
- (A) A
- (B) B
- (C) C ✓
- (D) D
Worked solution
A stream flows fastest where its gradient is steepest, which on a topographic map is shown by the most closely spaced contour lines; near point C the contour lines crossing Henry Creek are closest together, indicating the steepest slope and fastest flow.
A metamorphic rock with banding is described as having a
- (A) clastic texture
- (B) non-clastic texture
- (C) foliated texture ✓
- (D) non-foliated texture
Worked solution
Banding in a metamorphic rock is the visible result of mineral grains being aligned in parallel bands by directed pressure, which is the definition of a foliated texture.
The hardness of a mineral is primarily a result of the mineral's
- (A) mass
- (B) nonmetallic shape
- (C) pattern of breakage
- (D) internal arrangement of atoms ✓
Worked solution
A mineral's hardness is determined by how tightly and regularly its atoms are bonded together in its internal crystal structure, not by its mass, external shape, or breakage pattern.
Two sedimentary rocks formed from organic sediments are
- (A) bituminous coal and limestone ✓
- (B) bituminous coal and anthracite coal
- (C) rock gypsum and limestone
- (D) rock gypsum and anthracite coal
Worked solution
Bituminous coal and limestone are both classified as organic sedimentary rocks (formed from plant material and shell/organic debris, respectively), whereas anthracite coal is metamorphic and rock gypsum is a chemical (evaporite) sedimentary rock.
Bouvet Island is the most remote uninhabited island in the world. It is located above a geologic hot spot on the Southwest Indian Ridge. The closest landmass to the island is Antarctica, which is 1700 km away. Most of this volcanic island is currently covered by glaciers. Scientists inferred from drill core samples that the last massive lava flow that occurred on Bouvet Island was approximately 2000 years ago. The distance between Bouvet Island and Antarctica is approximately equal to the distance from Earth's surface to the
- (A) top of the asthenosphere
- (B) middle of the stiffer mantle ✓
- (C) bottom of the outer core
- (D) center of Earth
Worked solution
A depth of 1700 km falls roughly at the midpoint of the stiffer mantle layer (mesosphere) shown in the Earth Science Reference Tables' Earth's interior diagram, so the 1700 km surface distance to Antarctica is comparable to that depth.
Which cross section best represents the mantle convection currents formed beneath the Bouvet hot spot?
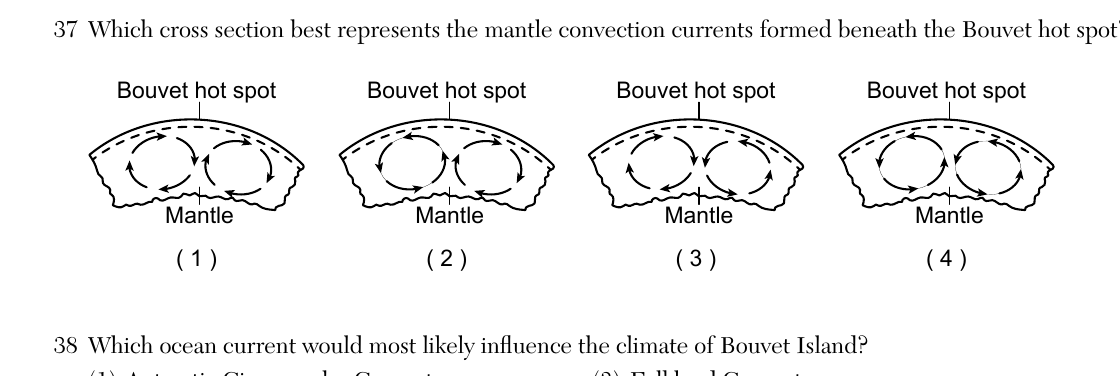
- (A) Cross section 1: convection cell arrows shown circulating in one arrangement beneath the hot spot
- (B) Cross section 2: convection cell arrows show two adjacent cells rising together beneath the hot spot and sinking outward at both far ends ✓
- (C) Cross section 3: convection cell arrows shown circulating in another arrangement beneath the hot spot
- (D) Cross section 4: convection cell arrows shown circulating in another arrangement beneath the hot spot
Worked solution
Beneath a hot spot, mantle material rises, so the correct convection pattern shows two adjacent cells with upward flow directly under the hot spot and downward flow (sinking) at the far outer edges of the cross section.
Which ocean current would most likely influence the climate of Bouvet Island?
- (A) Antarctic Circumpolar Current ✓
- (B) Brazil Current
- (C) Falkland Current
- (D) South Equatorial Current
Worked solution
Because Bouvet Island lies in the southern ocean close to Antarctica, it is most directly influenced by the Antarctic Circumpolar Current, which encircles the globe at that latitude, rather than currents found in lower latitudes like the Brazil, Falkland, or South Equatorial Currents.
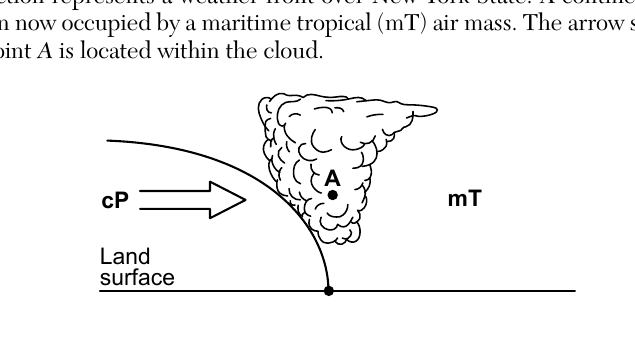
Base your answers to questions 39 through 41 on the cross section below and on your knowledge of Earth science. The cross section represents a weather front over New York State. A continental polar (cP) air mass is moving into the region now occupied by a maritime tropical (mT) air mass. The arrow shows the direction the cP air mass is moving. Point A is located within the cloud. Which type of frontal boundary is represented?
- (A) cold front ✓
- (B) warm front
- (C) occluded front
- (D) stationary front
Worked solution
The cross section shows the colder, denser continental polar air mass actively advancing and wedging beneath the warmer maritime tropical air mass along a steep boundary, which is characteristic of a cold front.
The relative humidity within the cloud at point A is most likely
- (A) 0%
- (B) 33%
- (C) 50%
- (D) 100% ✓
Worked solution
Since point A is located within a cloud, the air there is saturated with water vapor, meaning its relative humidity is 100%.
Which statement best describes why clouds are forming along the frontal boundary?
- (A) The mT air pushes the cP air up, causing it to compress and warm.
- (B) The mT air pushes the cP air up, causing it to expand and cool.
- (C) The cP air pushes the mT air up, causing it to compress and warm.
- (D) The cP air pushes the mT air up, causing it to expand and cool. ✓
Worked solution
The colder, denser continental polar air forces the warmer maritime tropical air upward; as that air rises it moves into lower atmospheric pressure, expands, and cools, eventually condensing to form the cloud along the frontal boundary.
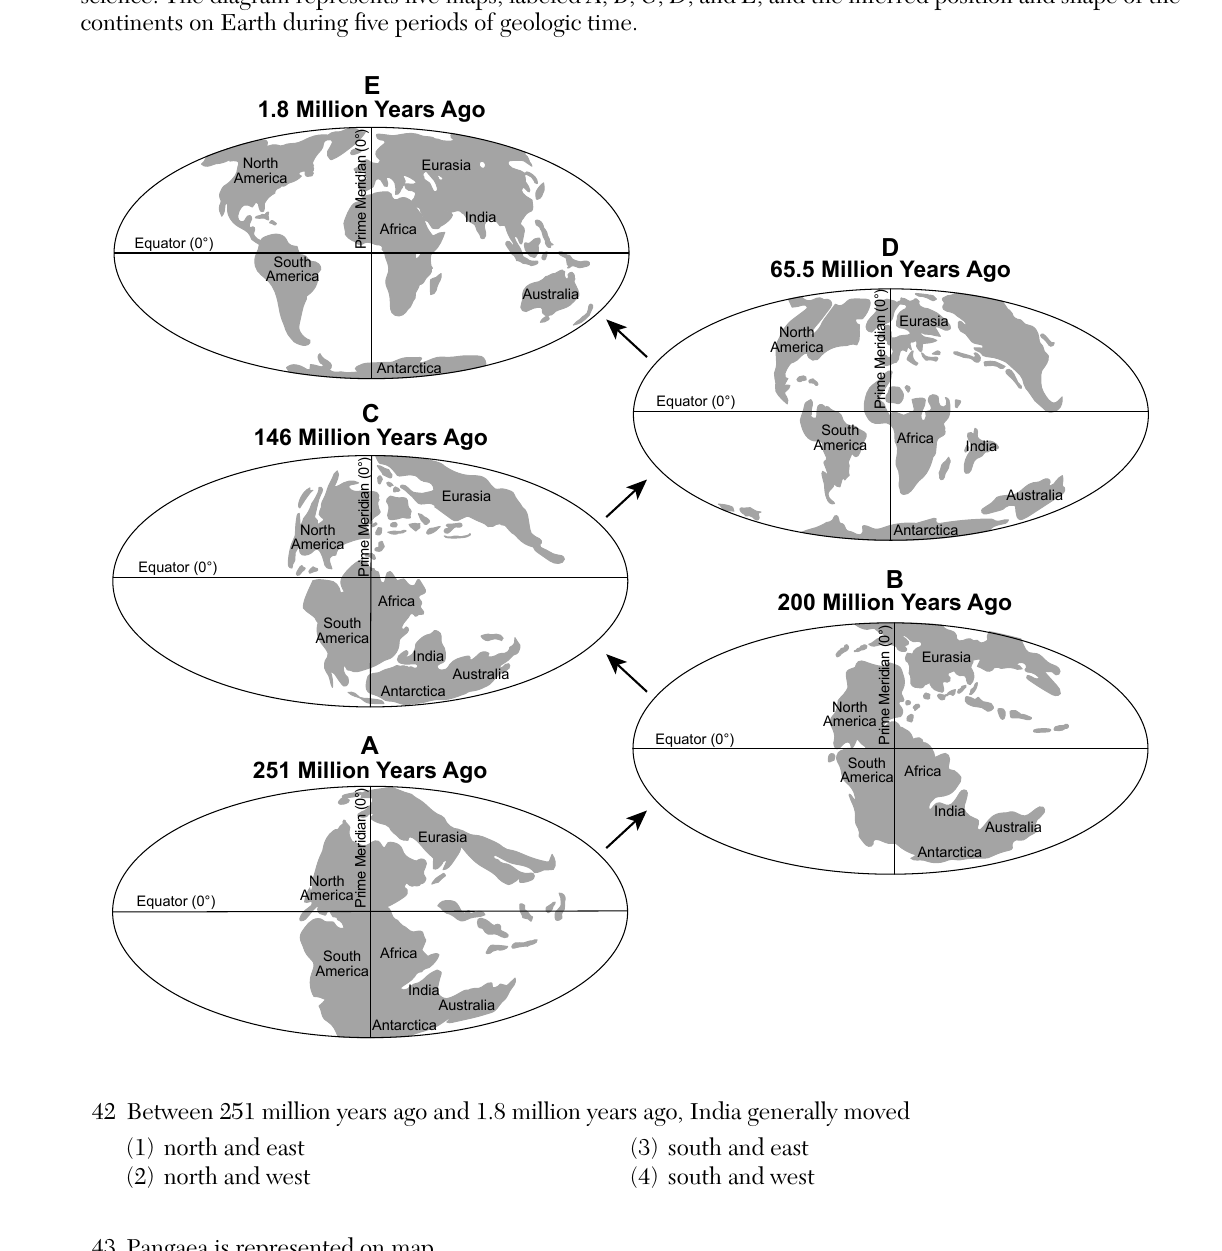
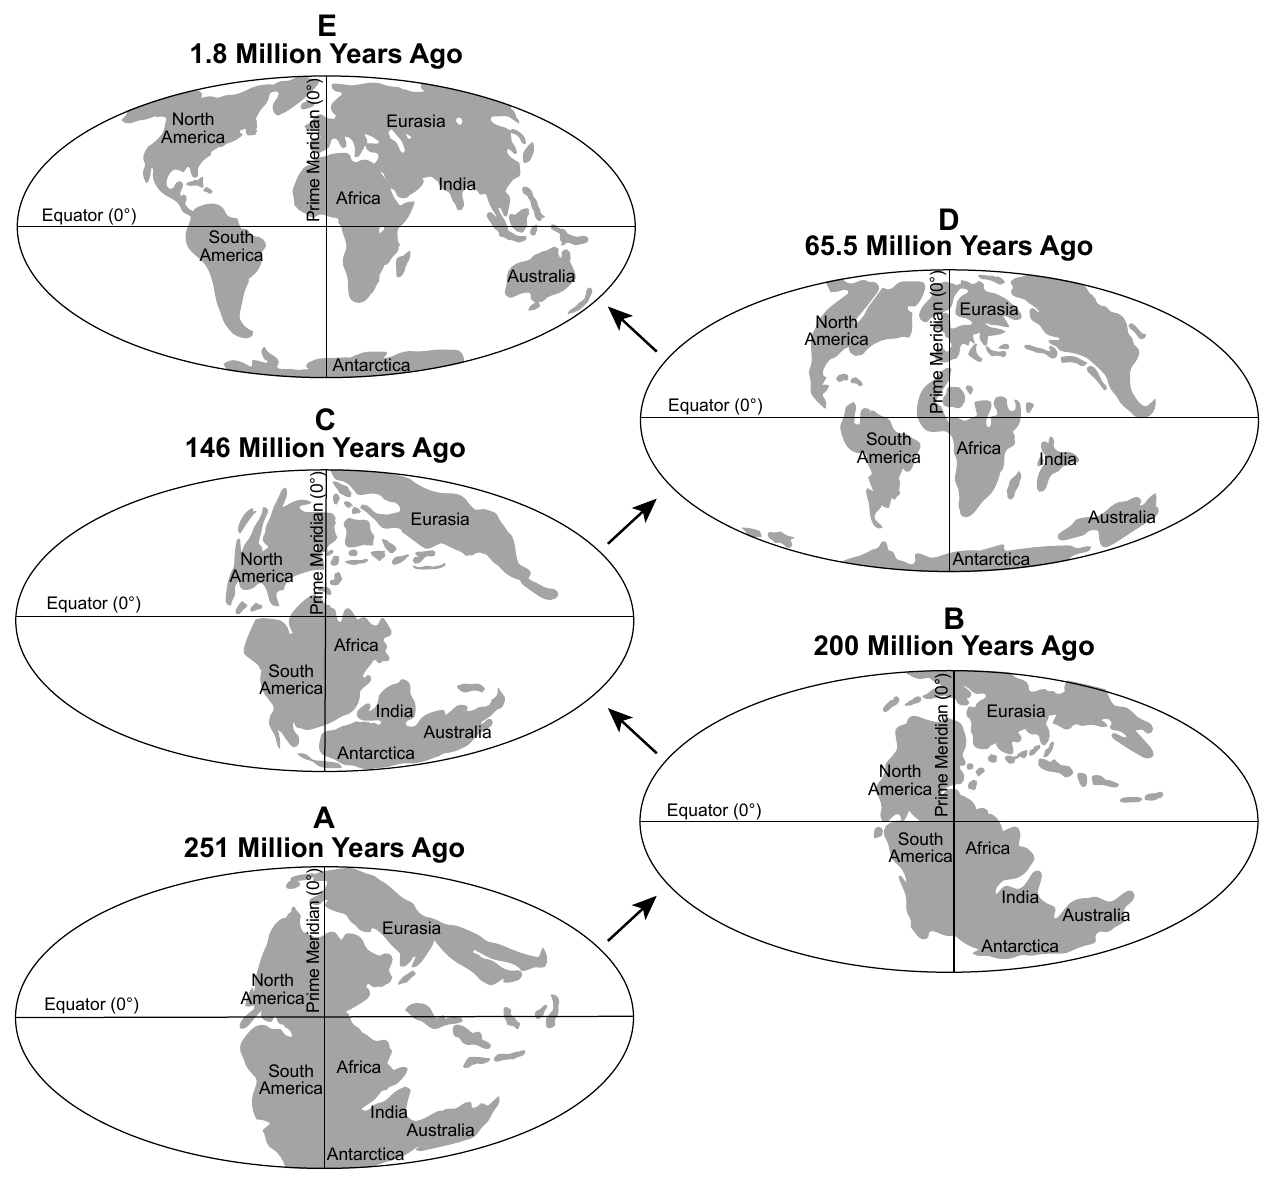
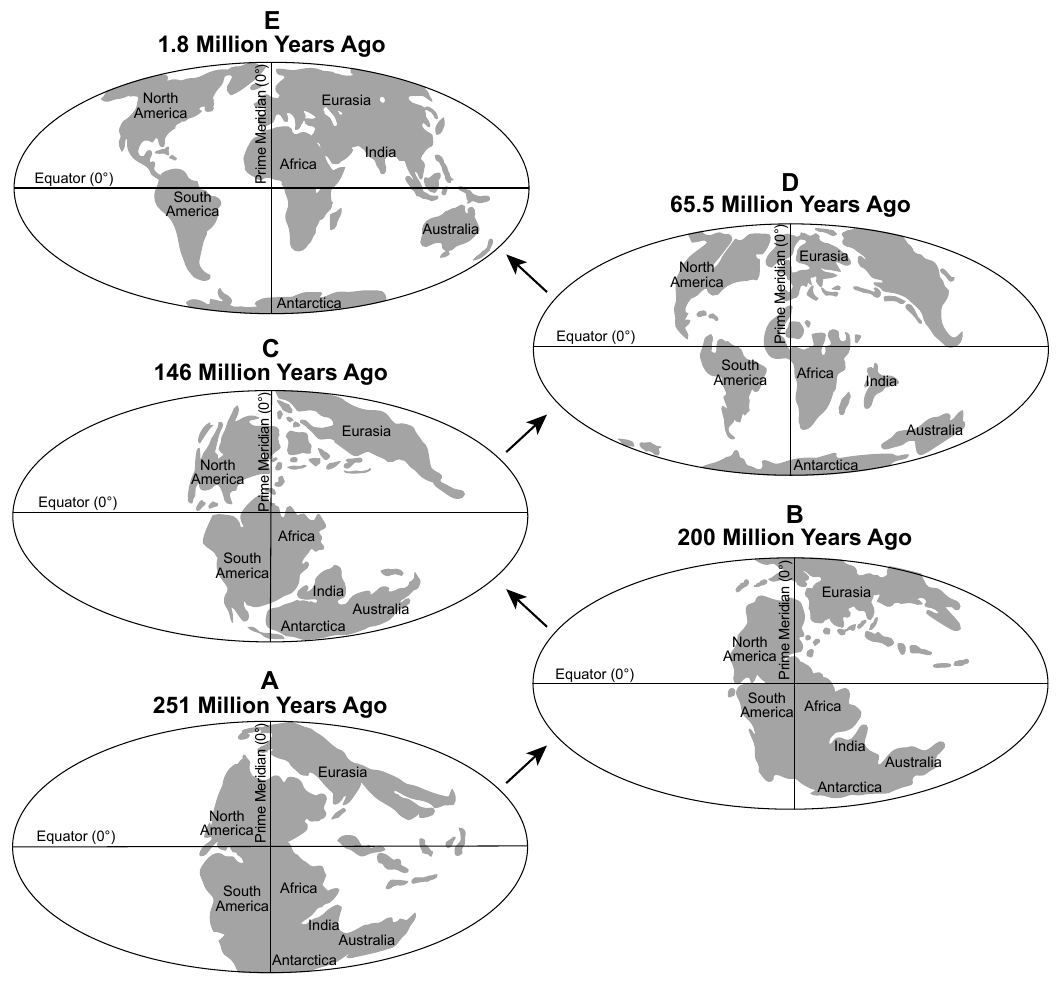
Base your answers to questions 42 through 44 on the diagram below and on your knowledge of Earth science. The diagram represents five maps, labeled A, B, C, D, and E, and the inferred position and shape of the continents on Earth during five periods of geologic time: A = 251 Million Years Ago, B = 200 Million Years Ago, C = 146 Million Years Ago, D = 65.5 Million Years Ago, E = 1.8 Million Years Ago. Between 251 million years ago and 1.8 million years ago, India generally moved
- (A) north and east ✓
- (B) north and west
- (C) south and east
- (D) south and west
Worked solution
Tracking India's position across the five paleogeographic maps shows it drifting away from its southern-hemisphere position near Antarctica, moving generally northward and eastward toward its collision with Asia by 1.8 million years ago.
Pangaea is represented on map
- (A) A ✓
- (B) E
- (C) C
- (D) D
Worked solution
Map A, dated 251 million years ago, shows all the continents fused into a single landmass, which corresponds to the supercontinent Pangaea.
Which group of organisms became extinct during the time represented on map A?
- (A) placoderm fish
- (B) dinosaurs
- (C) trilobites ✓
- (D) graptolites
Worked solution
Map A corresponds to 251 million years ago, the end of the Permian Period, when the end-Permian mass extinction event caused trilobites (which had survived since the early Paleozoic) to go completely extinct.
The rock that formed in the zones of contact metamorphism in the limestone is
- (A) quartzite
- (B) marble ✓
- (C) schist
- (D) gneiss
Worked solution
Limestone is a sedimentary rock made of calcite; when it undergoes contact metamorphism from heat given off by an intruding igneous body like the Purcell Sill, it recrystallizes into marble.
Which minerals are most likely found together in a sample of diorite taken from Purcell Sill?
- (A) quartz, plagioclase feldspar, and pyroxene
- (B) plagioclase feldspar, pyroxene, and olivine
- (C) plagioclase feldspar, biotite, and amphibole ✓
- (D) potassium feldspar, quartz, and biotite
Worked solution
On the Earth Science Reference Tables igneous rock identification chart, diorite is an intermediate rock composed mainly of plagioclase feldspar along with amphibole and biotite, with little or no quartz, pyroxene, or olivine.
The texture of the diorite found in the sill is best described as
- (A) fine-grained and non-vesicular
- (B) coarse-grained and non-vesicular ✓
- (C) fine-grained and vesicular
- (D) glassy and vesicular
Worked solution
Because the Purcell Sill is an intrusive body that cooled slowly underground, its diorite has large, visible crystals (coarse-grained) and lacks the gas bubble holes (vesicles) seen in rocks that cooled quickly at the surface.
The cross section below represents the shape of the stream channel between x and y at one location along the stream. Which location is best represented by this cross section?
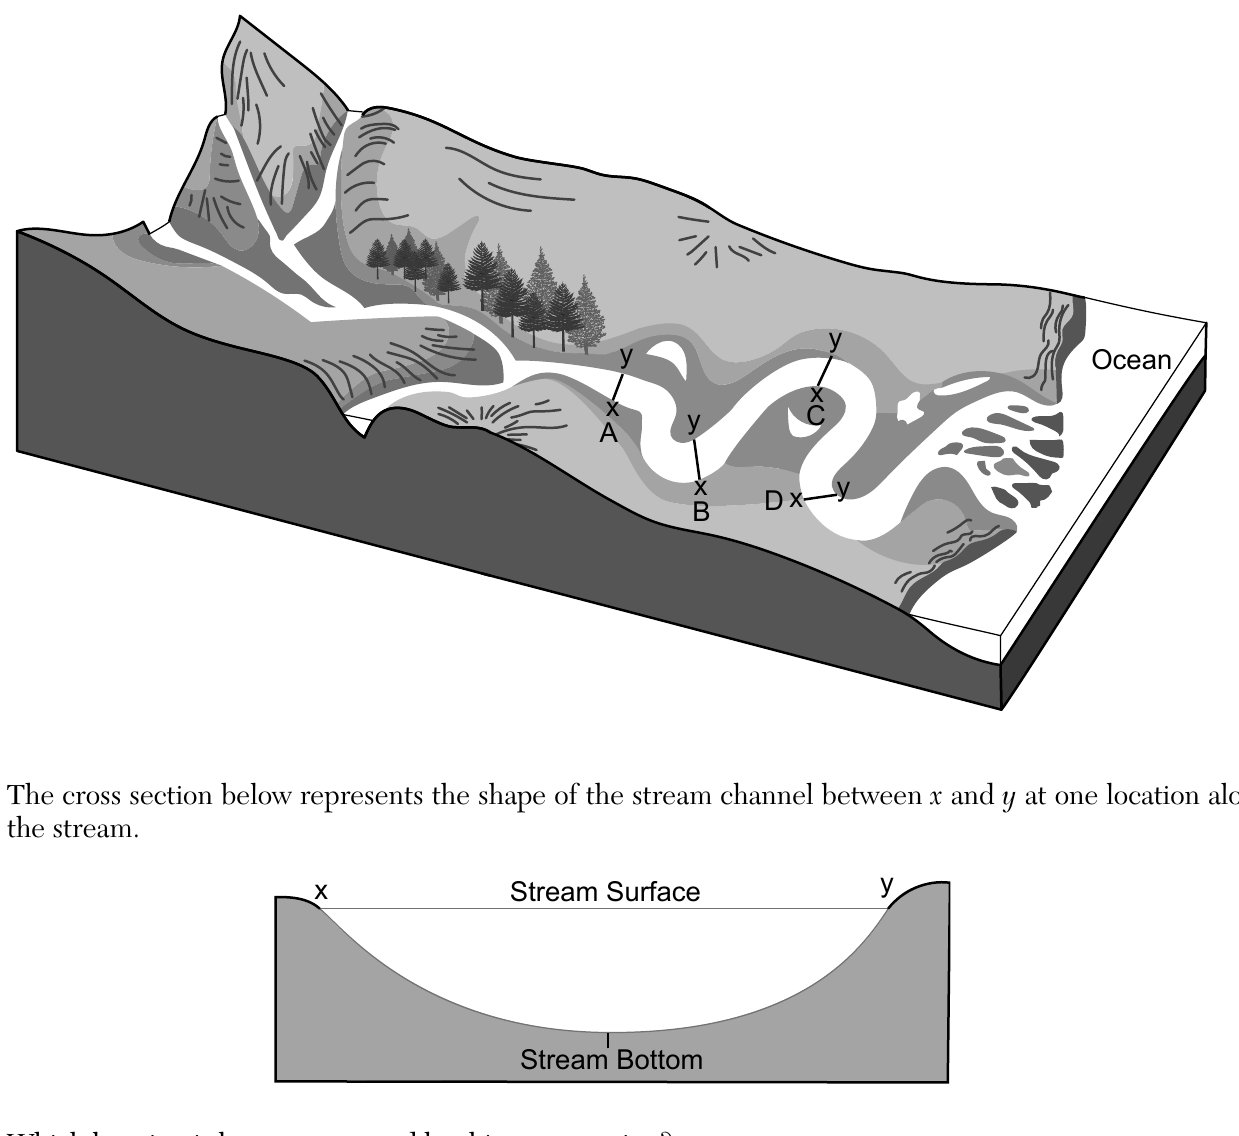
- (A) Location A ✓
- (B) Location B
- (C) Location C
- (D) Location D
Worked solution
A symmetric, evenly rounded channel shape (as opposed to a lopsided one with a steep cut bank on one side and a gentle deposit slope on the other) occurs along a relatively straight stretch of the stream, which matches Location A rather than the meander bends at B, C, or D.
The velocity at a certain location in this stream was measured to be 100 centimeters per second. What size sediment particles will be transported at this location?
- (A) clay, only
- (B) pebbles, only
- (C) clay, silt, and some sand, only
- (D) clay, silt, sand, and some pebbles, only ✓
Worked solution
Using the Earth Science Reference Tables graph relating stream velocity to the largest particle size that can be transported, a velocity of 100 cm/s is fast enough to carry clay, silt, and sand, and some (smaller) pebbles, but not the full range of pebbles or larger cobbles/boulders.
What is the name of the depositional feature located at the end of the stream where it enters the ocean?
- (A) floodplain
- (B) watershed
- (C) tributary
- (D) delta ✓
Worked solution
As a stream loses velocity entering the ocean, it deposits its sediment load, building a fan-shaped depositional feature called a delta at its mouth.
Identify the nuclear process that produces energy in stars.
Worked solution
The passage describes hydrogen nuclei combining to form helium, releasing energy; this combining of atomic nuclei is called nuclear fusion.
Identify one star that was formerly a Sun-sized star, but is now in its late stage of existence.
Worked solution
According to the passage, a star about the size of the Sun ends its life as a white dwarf; the Reference Tables' Characteristics of Stars chart lists white dwarfs such as Sirius B, Procyon B, and 40 Eridani B as examples.
Barnard's Star and Betelgeuse are stars having similar color and surface temperature. Explain why Betelgeuse will most likely undergo a supernova but Barnard's Star will not.
Worked solution
Even though the two stars share a similar color and surface temperature, Betelgeuse is a supergiant with vastly more mass, and only very massive stars end their lives explosively as supernovae, whereas the low-mass Barnard's Star will end as a white dwarf without a supernova.
Identify the geologic period when Glacial Lake Albany was first formed.
Worked solution
An event 15,000 years ago falls within the most recent period on the geologic time scale, the Quaternary Period (Pleistocene Epoch), which includes the end of the last ice age.
Identify the entire range of sand sizes covering the lake floor when Glacial Lake Albany drained.
Worked solution
On the Earth Science Reference Tables particle-size scale, sand-sized sediment spans from 0.006 cm (the silt/sand boundary) up to 0.2 cm (the sand/pebble boundary).
Identify the agent of erosion that formed the sand dunes from the sediments left on the lake floor after Glacial Lake Albany drained.
Worked solution
The passage states the sandy lake-floor deposits were blown into dunes, indicating wind was the agent of erosion and deposition responsible for forming the dunes.
Determine the height of the tide at 5 p.m. on Saturday.
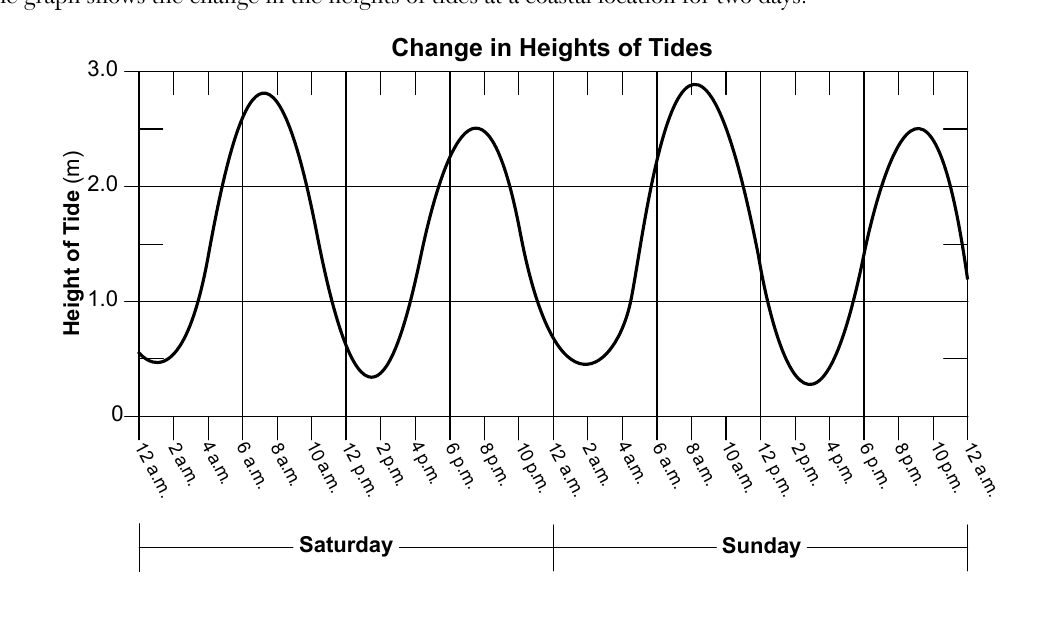
Worked solution
At 5 p.m. Saturday the tide curve is rising steeply from its early-afternoon low toward its evening high, so the height read from the graph at that time is approximately 1.8 to 2.2 meters.
Predict the time of the next high tide on Monday. Include a.m. or p.m. in your answer.
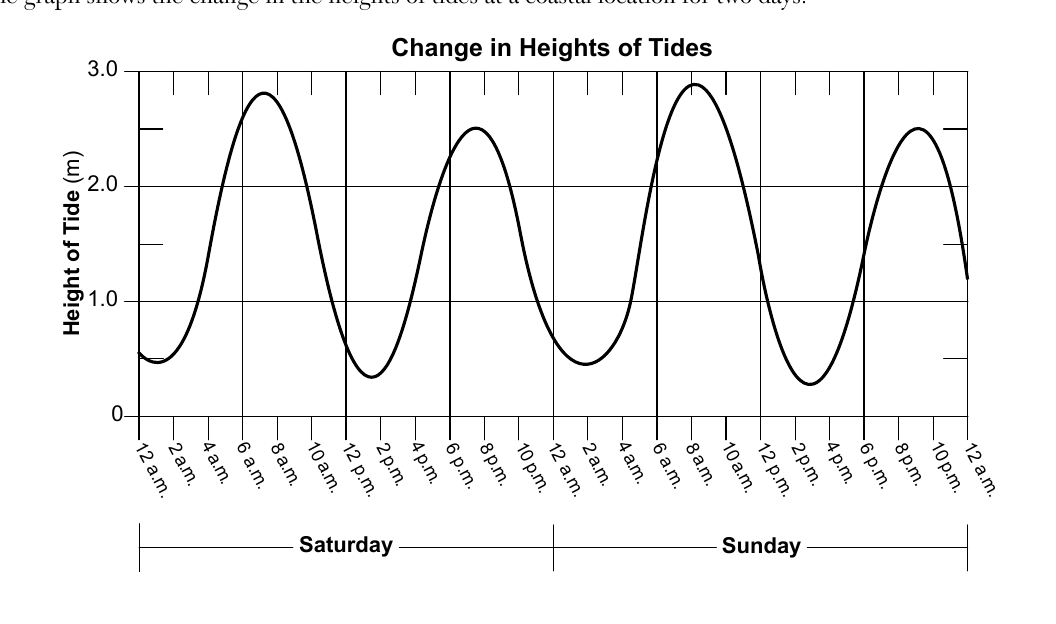
Worked solution
Since the graph shows a regular pattern of high tides roughly every 12 hours occurring near 8 a.m. and 8 p.m., continuing that pattern from the Sunday evening high tide predicts the next high tide near 8 a.m. Monday.
Identify the force that causes tides.
Worked solution
Tides are caused by the force of gravity, primarily the Moon's gravitational pull on Earth's oceans, with an additional smaller contribution from the Sun.
Describe how the thickness of cloud cover at a particular location affects the relative amount of solar radiation reaching Earth's surface.
Worked solution
The diagram shows thicker clouds reflecting a larger share of incoming solar radiation back to space than thin clouds do, so the thicker the cloud cover, the less solar radiation reaches Earth's surface.
State the name of the temperature zone of Earth's atmosphere where most clouds form.
Worked solution
Nearly all clouds and weather occur in the troposphere, the lowest layer of Earth's atmosphere, where temperature decreases with increasing height.
On the diagram in your answer booklet, shade the portion of Earth that represents nighttime.
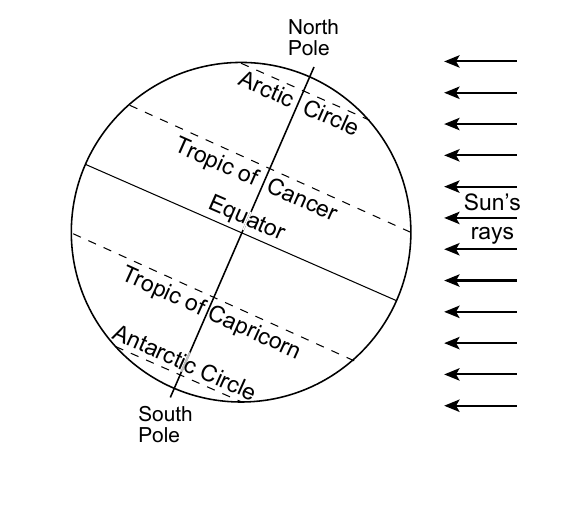
Worked solution
On any diagram of Earth viewed from space with parallel sunlight rays drawn, the correct shading task is to shade the hemisphere on the side of Earth facing away from the Sun, since that half is in darkness (nighttime) while the sunlit half is daytime.
Identify the season that is beginning in the northern hemisphere when Earth is in this position.
Worked solution
The North Pole is tilted toward the Sun, placing the Sun's direct rays on the Tropic of Cancer. That is the June solstice, so the season beginning in the Northern Hemisphere is summer.
State the number of daylight hours that an observer at the equator would experience on this day.
Worked solution
Because the circle of illumination always divides the equator exactly in half, an observer at the equator experiences 12 hours of daylight on any day of the year, including the day shown in this diagram.
Compared to current summer and winter temperatures in New York State, describe how New York State's summer and winter temperatures would change if Earth's rotational axis were tilted at 33.5 degrees instead of 23.5 degrees.
Worked solution
Increasing Earth's axial tilt from 23.5 degrees to 33.5 degrees would increase the range of the Sun's noon altitude throughout the year at New York's latitude, making summer insolation more direct and intense (warmer summers) and winter insolation more indirect (colder winters), so the difference between summer and winter temperatures would grow larger.
Identify the process that recrystallizes silica-rich rock and limestone into wollastonite using heat and pressure.
Worked solution
The recrystallization of pre-existing rock under elevated heat and pressure, without melting, that forms a new mineral like wollastonite is the process of metamorphism.
Base your answers to questions 66 through 68 on the passage and map below and on your knowledge of Earth science. The map shows a portion of northeastern New York State and northwestern Vermont. Wollastonite, A Versatile Industrial Mineral Wollastonite is a mineral composed of calcium, silicon, and oxygen (CaSiO3). The formation of wollastonite can occur when a large area of silica-rich rock and limestone is deeply buried and recrystallized at temperatures from 400°C to 450°C. The Lewis Deposit, located in Willsboro, New York, contains approximately 60% wollastonite. Since the early 1980s wollastonite has been used as a replacement for asbestos in products such as insulating boards and panels, roofing tiles, and brakes. Wollastonite is also used in ceramic glaze mixes. 67 Identify one mineral, other than wollastonite, that is used in ceramics.
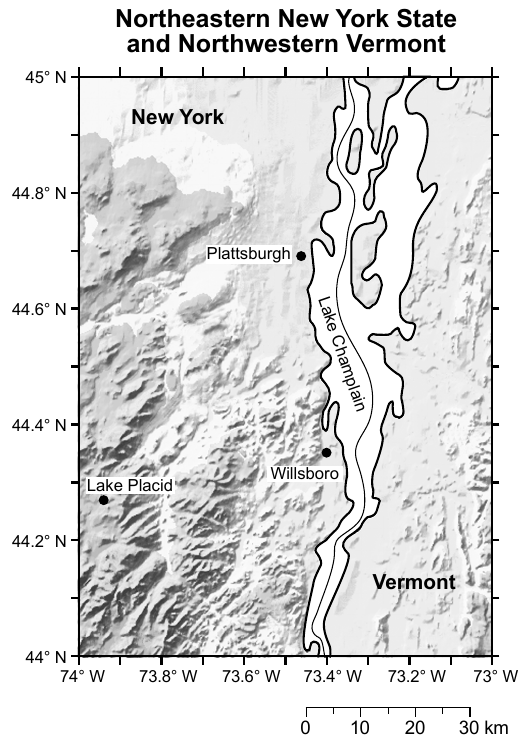
Worked solution
Any mineral commonly used as a raw material in ceramics other than wollastonite is acceptable, such as feldspar, quartz, or kaolinite (clay).
Base your answers to questions 66 through 68 on the passage and map below and on your knowledge of Earth science. The map shows a portion of northeastern New York State and northwestern Vermont. Wollastonite, A Versatile Industrial Mineral Wollastonite is a mineral composed of calcium, silicon, and oxygen (CaSiO3). The formation of wollastonite can occur when a large area of silica-rich rock and limestone is deeply buried and recrystallized at temperatures from 400°C to 450°C. The Lewis Deposit, located in Willsboro, New York, contains approximately 60% wollastonite. Since the early 1980s wollastonite has been used as a replacement for asbestos in products such as insulating boards and panels, roofing tiles, and brakes. Wollastonite is also used in ceramic glaze mixes. Identify the New York State landscape region in which Plattsburgh, New York, is located.
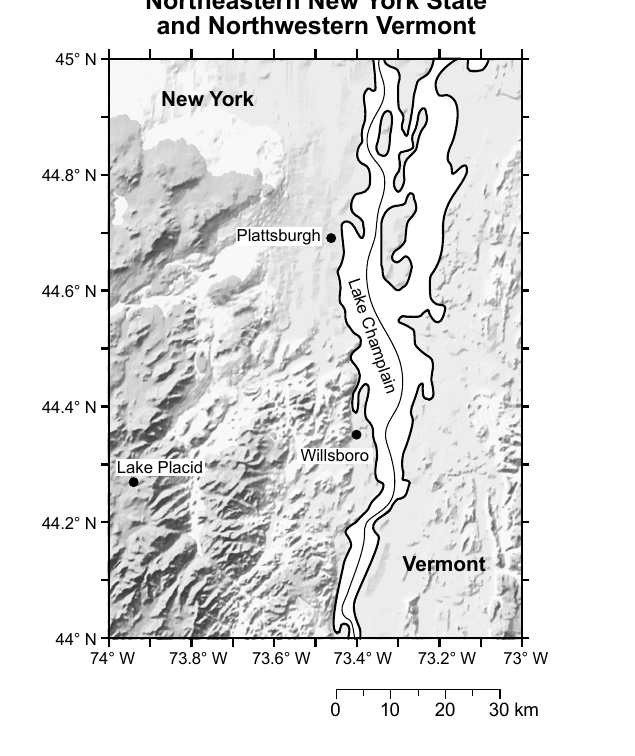
Worked solution
Plattsburgh sits in the low-lying land bordering Lake Champlain, which is designated the Champlain Lowlands on the New York State Landscape Regions map.
Base your answers to questions 69 and 70 on the diagram and table below and on your knowledge of Earth science. The diagram represents the laboratory materials used for investigations of how bead diameter affects infiltration, porosity, and water retention. Each column was filled to the same level with uniform-sized, dry, spherical beads. Water was added to fill each column to the top of the beads. The clamps were then opened to allow the water to drain into the beakers beneath each column. The time it took the water to drain and the amount of water left in each column was calculated. The table shows the results of the investigation. Effects of Bead Diameter | Bead Diameter (mm) | Infiltration Rate (mm/s) | Porosity (%) | Retention (mL) | | --- | --- | --- | --- | | 0.4 | 18 | 40 | 22 | | 1.0 | 25 | 40 | 16 | | 2.1 | 31 | 40 | 11 | | 3.5 | 34 | 40 | 9 | | 5.0 | 36 | 40 | 5 | 69 On the grid in your answer booklet, construct a line graph by plotting the infiltration rates for the five bead diameters listed in the table. Connect the five plots with a line.
Worked solution
Plotting infiltration rate against bead diameter and connecting the five points shows infiltration rate rising as bead size increases.
Base your answers to questions 69 and 70 on the diagram and table below and on your knowledge of Earth science. The diagram represents the laboratory materials used for investigations of how bead diameter affects infiltration, porosity, and water retention. Each column was filled to the same level with uniform-sized, dry, spherical beads. Water was added to fill each column to the top of the beads. The clamps were then opened to allow the water to drain into the beakers beneath each column. The time it took the water to drain and the amount of water left in each column was calculated. The table shows the results of the investigation. Effects of Bead Diameter | Bead Diameter (mm) | Infiltration Rate (mm/s) | Porosity (%) | Retention (mL) | | --- | --- | --- | --- | | 0.4 | 18 | 40 | 22 | | 1.0 | 25 | 40 | 16 | | 2.1 | 31 | 40 | 11 | | 3.5 | 34 | 40 | 9 | | 5.0 | 36 | 40 | 5 | 70 State the relationship between increasing bead size and the amount of water retention in the column.
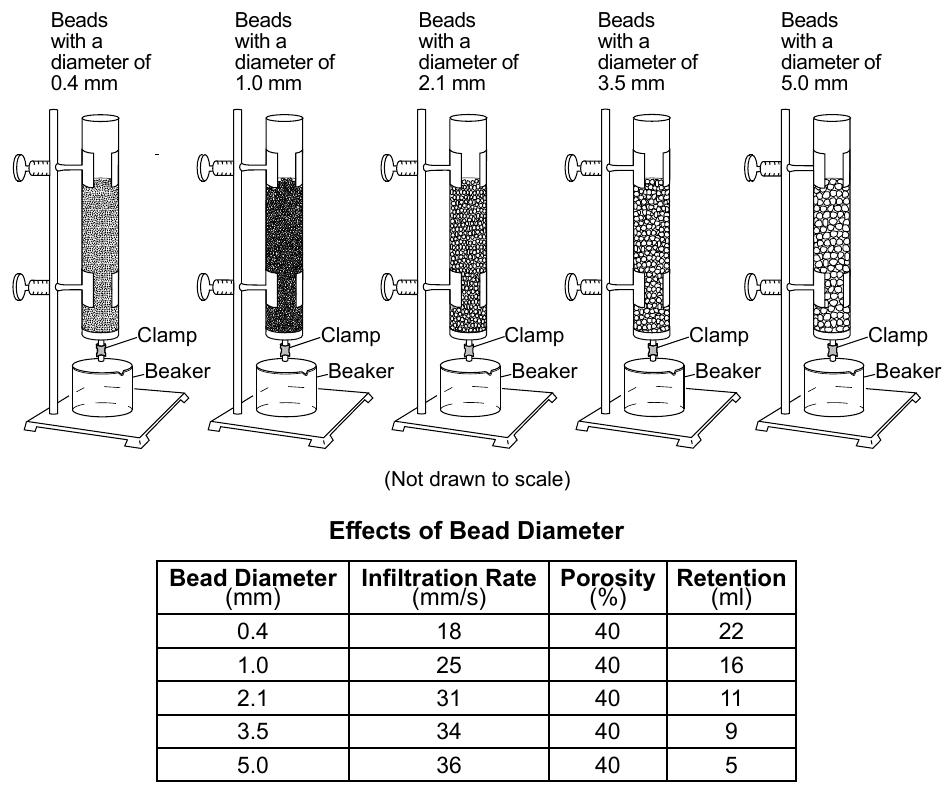
Worked solution
The table shows retention falling from 22 mL to 5 mL as bead diameter rises from 0.4 mm to 5.0 mm, so the relationship is inverse: bigger beads hold less water.
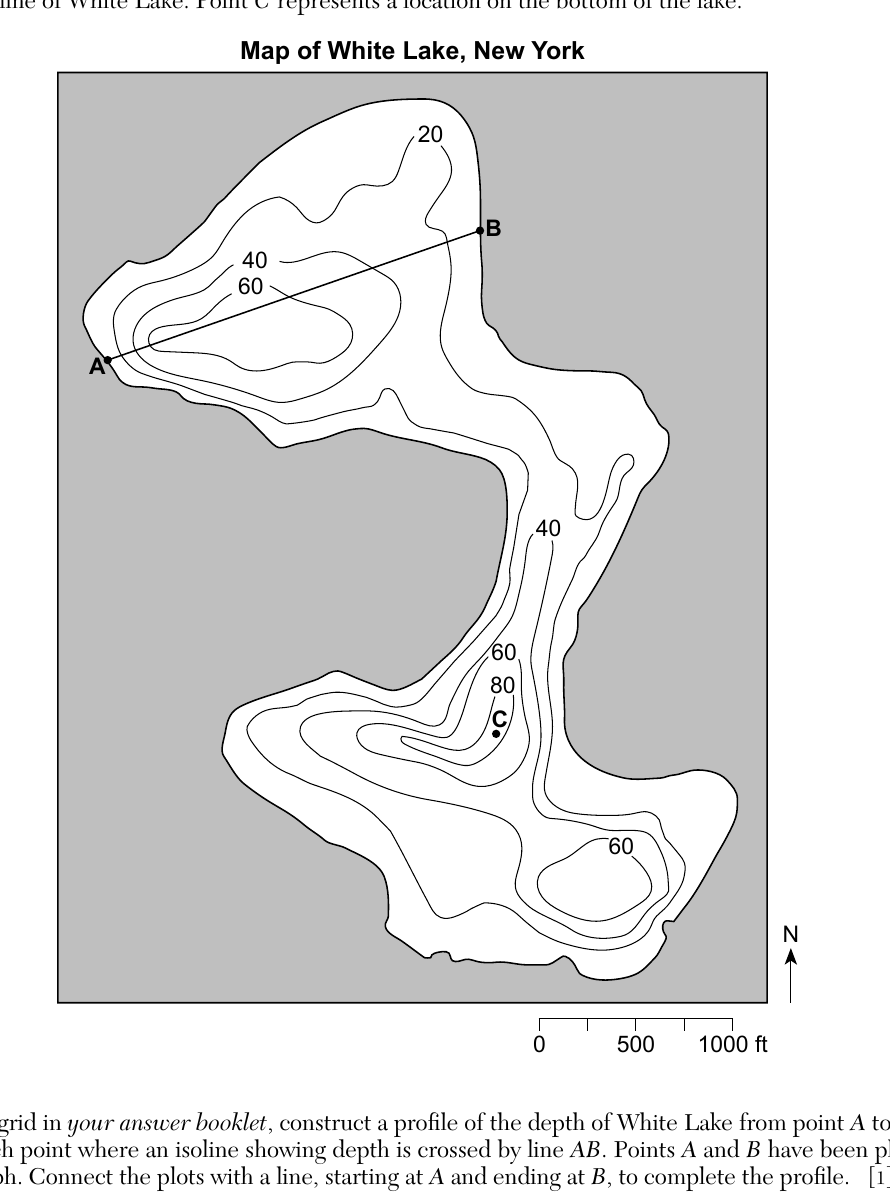
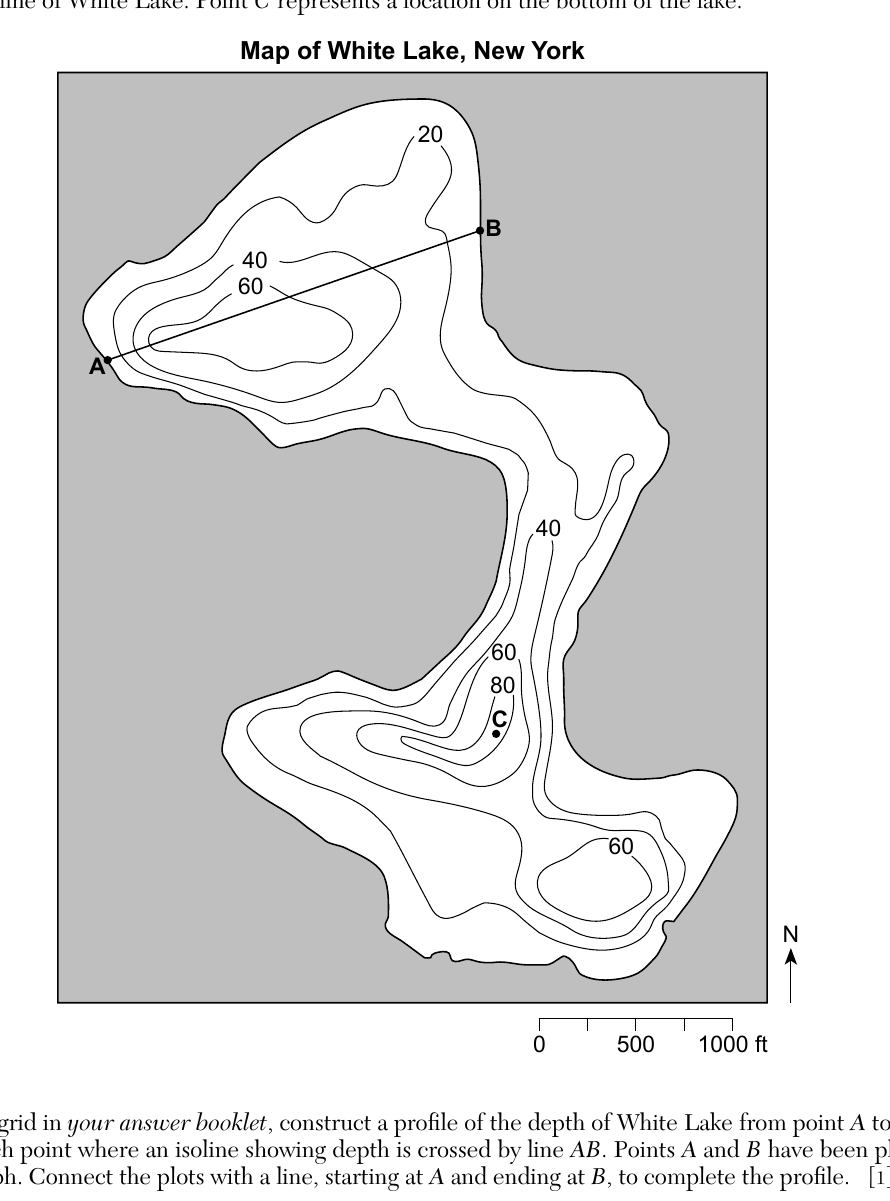
Base your answers to questions 71 and 72 on the bathymetric map below and on your knowledge of Earth science. The map shows the depth of White Lake located in Sullivan County, New York. Isoline values indicate water depth in feet. The surface of White Lake is 1323 feet above sea level. Points A and B represent locations on the shoreline of White Lake. Point C represents a location on the bottom of the lake. On the grid in your answer booklet, construct a profile of the depth of White Lake from point A to point B. Plot each point where an isoline showing depth is crossed by line AB. Points A and B have been plotted on the graph. Connect the plots with a line, starting at A and ending at B, to complete the profile.
Worked solution
A topographic/bathymetric profile is built by plotting the elevation (here, depth) at every point where the traverse line crosses a contour, then connecting those points in order.
Base your answers to questions 71 and 72 on the bathymetric map below and on your knowledge of Earth science. The map shows the depth of White Lake located in Sullivan County, New York. Isoline values indicate water depth in feet. The surface of White Lake is 1323 feet above sea level. Points A and B represent locations on the shoreline of White Lake. Point C represents a location on the bottom of the lake. State one possible water depth at point C.
Worked solution
Because point C lies within the innermost (80 ft) closed contour and no higher contour is shown, its true depth must be greater than 80 ft but less than the next contour interval of 100 ft, so any value in that range, such as 85 feet, is acceptable.
Base your answers to questions 73 through 75 on the data table below and on your knowledge of Earth science. The data table lists the distance from Earth to the Moon and the percentage of the lighted portion of the Moon visible from Earth each day for a 9-day period. | Day | Approximate Earth-Moon Distance (km) | Lighted portion of Moon Visible (%) | | --- | --- | --- | | 1 | 393,300 | 84 | | 2 | 397,600 | 76 | | 3 | 400,900 | 67 | | 4 | 403,200 | 58 | | 5 | 404,300 | 49 | | 6 | 404,000 | 39 | | 7 | 402,500 | 30 | | 8 | 399,800 | 22 | | 9 | 396,300 | 14 | 73 On the diagram in your answer booklet, place an X on the Moon's orbit to show the approximate position of the Moon on day 5.
The answer booklet diagram shows the Moon's slightly elliptical orbit around Earth, with Earth positioned off-center so that one side of the orbit is closest to Earth (perigee) and the opposite side is farthest from Earth (apogee). Use the data table: on day 5 the Earth-Moon distance (404,300 km) is the greatest value listed, so the X belongs at the point on the orbit farthest from Earth.
Worked solution
Since day 5 has the largest Earth-Moon distance listed, the Moon on that day is at apogee, the point on its elliptical orbit farthest from Earth.
Base your answers to questions 73 through 75 on the data table below and on your knowledge of Earth science. The data table lists the distance from Earth to the Moon and the percentage of the lighted portion of the Moon visible from Earth each day for a 9-day period. | Day | Approximate Earth-Moon Distance (km) | Lighted portion of Moon Visible (%) | | --- | --- | --- | | 1 | 393,300 | 84 | | 2 | 397,600 | 76 | | 3 | 400,900 | 67 | | 4 | 403,200 | 58 | | 5 | 404,300 | 49 | | 6 | 404,000 | 39 | | 7 | 402,500 | 30 | | 8 | 399,800 | 22 | | 9 | 396,300 | 14 | 74 State the number of days (d) it takes the Moon to complete one cycle of phases from one full moon to the next full moon.
Worked solution
The time from one full moon to the next full moon is the synodic month, which is about 29.5 days.
Base your answers to questions 73 through 75 on the data table below and on your knowledge of Earth science. The data table lists the distance from Earth to the Moon and the percentage of the lighted portion of the Moon visible from Earth each day for a 9-day period. | Day | Approximate Earth-Moon Distance (km) | Lighted portion of Moon Visible (%) | | --- | --- | --- | | 1 | 393,300 | 84 | | 2 | 397,600 | 76 | | 3 | 400,900 | 67 | | 4 | 403,200 | 58 | | 5 | 404,300 | 49 | | 6 | 404,000 | 39 | | 7 | 402,500 | 30 | | 8 | 399,800 | 22 | | 9 | 396,300 | 14 | 75 Explain how the data provide evidence that the Moon has an elliptical orbit around Earth.
Worked solution
Because the recorded Earth-Moon distance rises and falls rather than staying fixed, the Moon's path around Earth cannot be a circle centered on Earth; the changing distance is the signature of an elliptical orbit.
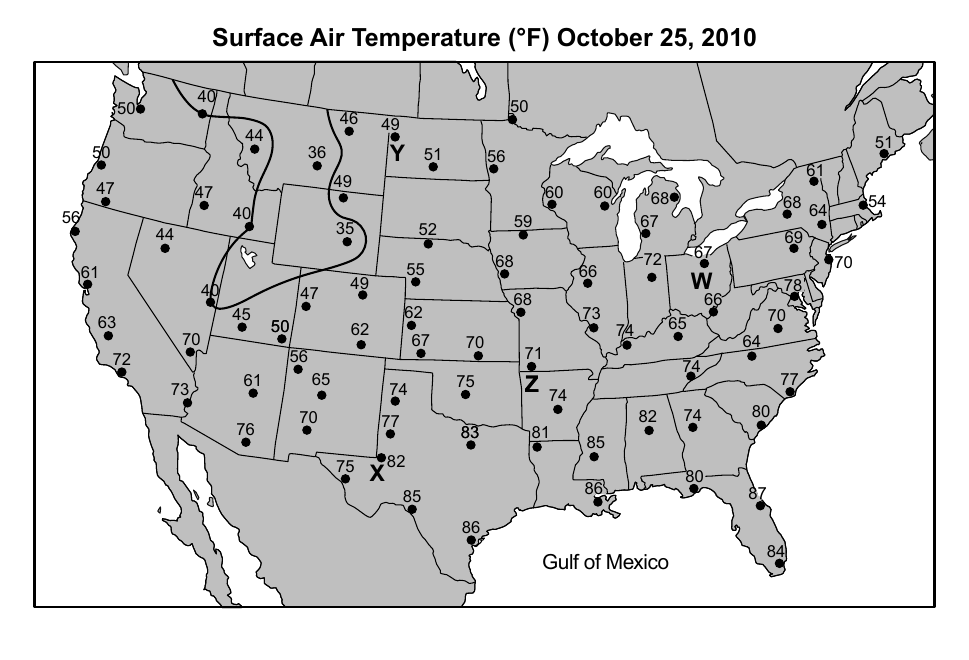
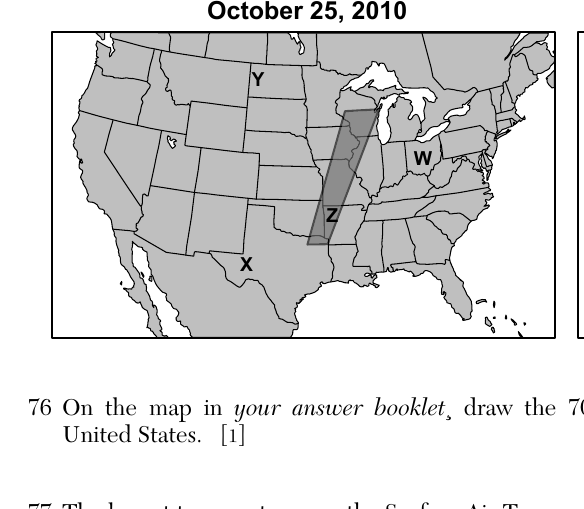
Base your answers to questions 76 through 79 on the Surface Air Temperature map in your answer booklet, the two Extreme Storms and Winds maps below, and on your knowledge of Earth science. The Surface Air Temperature map shows the surface air temperatures, recorded in degrees Fahrenheit (°F), across the United States at 6 p.m. on October 25, 2010. The 40°F isotherm is drawn. The shaded portions on the two Extreme Storms and Winds maps show the areas where extreme storms and winds (including tornadoes) were forecasted on October 25, 2010 and October 26, 2010. Letters W, X, Y, and Z represent the same surface locations on all maps. On the map in your answer booklet, draw the 70°F isotherm. Extend the line to the edges of the United States.
Worked solution
An isotherm is drawn by connecting points of equal temperature; the 70°F line is traced by interpolating between the plotted station values and extended to the boundary of the map.
Base your answers to questions 76 through 79 on the Surface Air Temperature map in your answer booklet, the two Extreme Storms and Winds maps below, and on your knowledge of Earth science. 77 The lowest temperatures on the Surface Air Temperature map are inside the 40°F isotherm. This region is part of the Rocky Mountains. Identify the climate factor that accounts for the low surface air temperatures in this mountain region.
Worked solution
The Rocky Mountains reach high elevations, and temperature drops as elevation increases, which explains the unusually cool readings there compared to surrounding lower-elevation areas.
Base your answers to questions 76 through 79 on the Surface Air Temperature map in your answer booklet, the two Extreme Storms and Winds maps below, and on your knowledge of Earth science. Identify the evidence on the October 25 Extreme Storms and Winds map that indicates location Z has a dewpoint that is close to the air temperature.
Worked solution
Because location Z falls within the area forecast for severe storms and tornadoes, the air there must be saturated enough to produce clouds and precipitation, which only occurs when the dewpoint is nearly equal to the air temperature.
Base your answers to questions 76 through 79 on the Surface Air Temperature map in your answer booklet, the two Extreme Storms and Winds maps below, and on your knowledge of Earth science. 79 Other than stocking up on food and water, describe two emergency actions that should be taken in order to prevent loss of life and property in the regions where damaging storms and possible tornadoes were forecast on October 25 and 26.
Worked solution
Standard severe weather safety practice calls for taking shelter in the safest interior part of a sturdy building and evacuating people from mobile homes or flimsy structures that tornadoes and high winds can destroy.
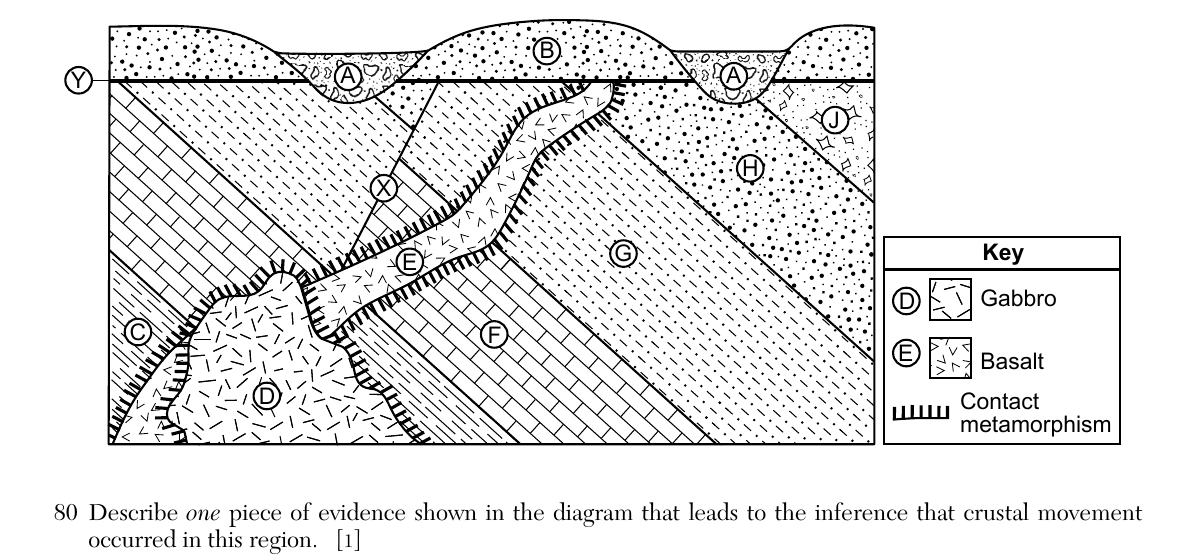
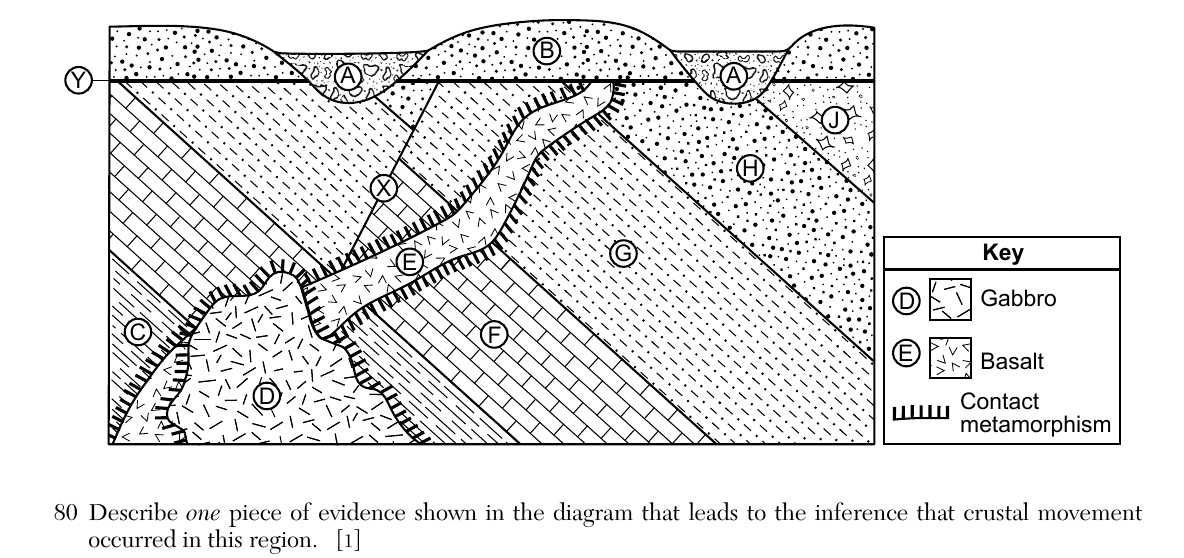
Base your answers to questions 80 through 82 on the cross section below and on your knowledge of Earth science. Letters A through J represent different rock units. Letter X represents a fault line, and letter Y represents an unconformity. The rock units have not been overturned. 80 Describe one piece of evidence shown in the diagram that leads to the inference that crustal movement occurred in this region.
Worked solution
Displacement of rock layers across fault X, or alternatively the tilting of the lower rock units, both indicate that the crust in this region has moved after the rocks formed.
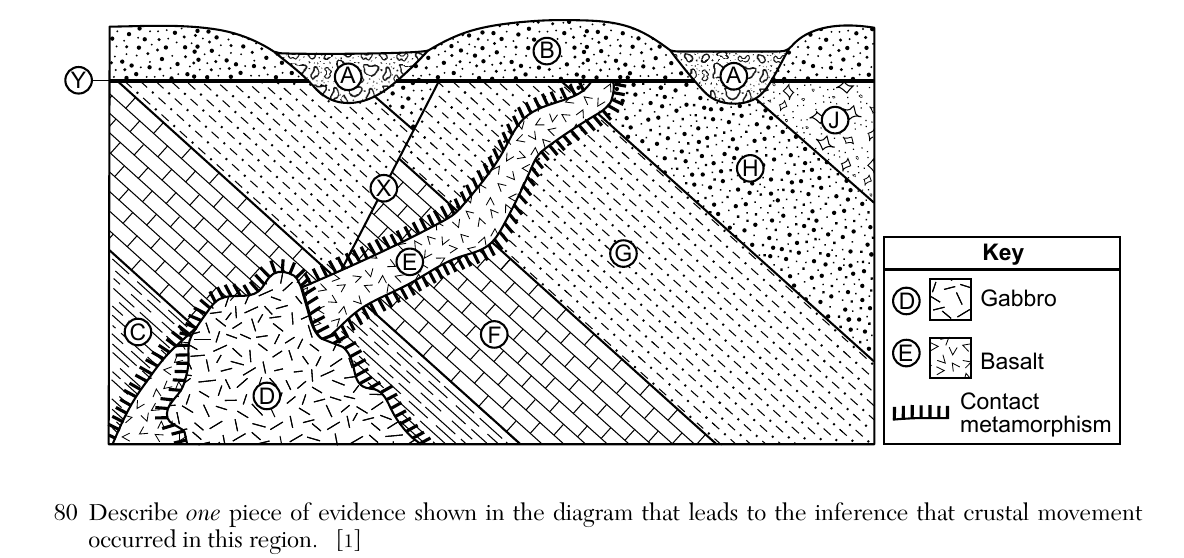
Base your answers to questions 80 through 82 on the cross section below and on your knowledge of Earth science. Letters A through J represent different rock units. Letter X represents a fault line, and letter Y represents an unconformity. The rock units have not been overturned. 81 Place the letters of the following rock units and the fault in order from oldest to youngest. C D E Fault X
Worked solution
Using the principle of cross-cutting relationships, an intrusion or fault is always younger than the rock it cuts through: D intrudes C, E cuts across C and D, and fault X displaces E, giving the order C, D, E, then Fault X.
Base your answers to questions 80 through 82 on the cross section below and on your knowledge of Earth science. Letters A through J represent different rock units. Letter X represents a fault line, and letter Y represents an unconformity. The rock units have not been overturned. 82 Rock unit G formed during the late Cambrian period, and Rock unit J formed during the early Ordovician period. Identify the name of one New York State index fossil that could possibly be found in Rock unit H.
Worked solution
Because rock unit H sits between a late Cambrian unit and an early Ordovician unit, it formed near the Cambrian-Ordovician boundary; trilobites are New York State index fossils known from rock of that age.
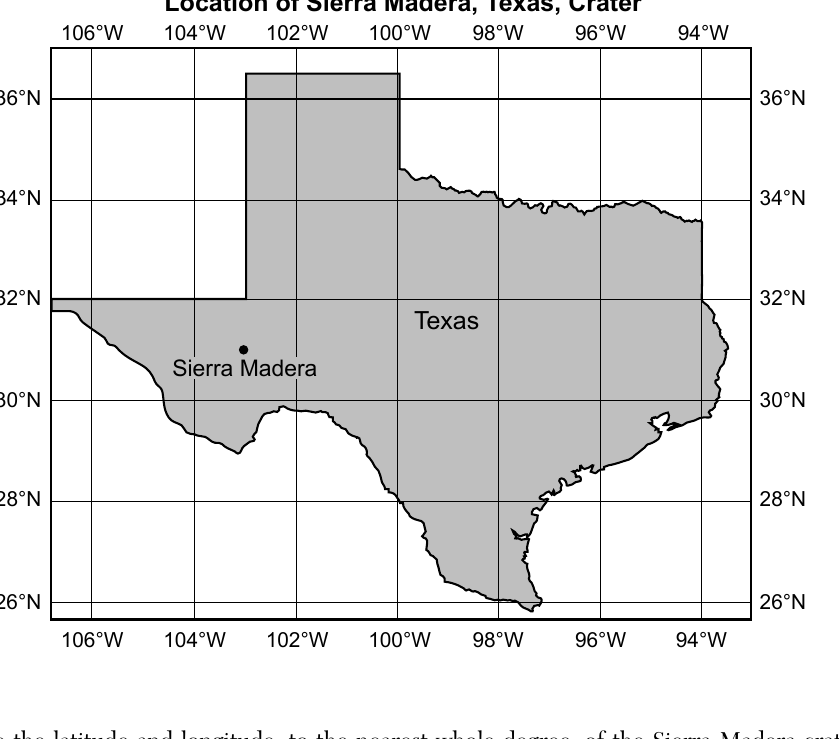
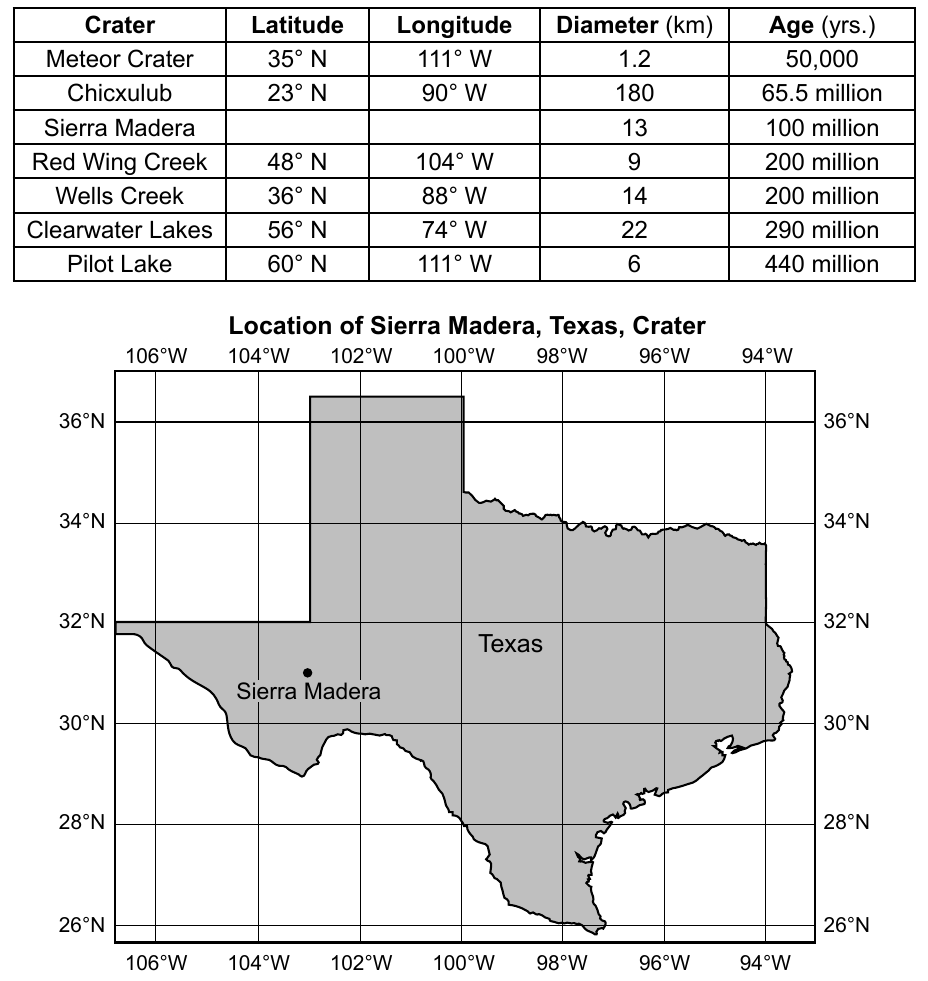
Base your answers to questions 83 through 85 on the data table and map below and on your knowledge of Earth science. The data table shows the location, diameter, and age of some impact craters on Earth. The latitude and longitude of the Sierra Madera, Texas, crater has been left blank. The location of the Sierra Madera crater is indicated on the map of Texas. | Crater | Latitude | Longitude | Diameter (km) | Age (yrs.) | | --- | --- | --- | --- | --- | | Meteor Crater | 35°N | 111°W | 1.2 | 50,000 | | Chicxulub | 23°N | 90°W | 180 | 65.5 million | | Sierra Madera | | | 13 | 100 million | | Red Wing Creek | 48°N | 104°W | 9 | 200 million | | Wells Creek | 36°N | 88°W | 14 | 200 million | | Clearwater Lakes | 56°N | 74°W | 22 | 290 million | | Pilot Lake | 60°N | 111°W | 6 | 440 million | 83 Determine the latitude and longitude, to the nearest whole degree, of the Sierra Madera crater. Include units and compass directions in your answer.
Worked solution
The dot marking Sierra Madera on the Texas map falls closest to the 30°N latitude line and the 102°W longitude line.
Base your answers to questions 83 through 85 on the data table and map below and on your knowledge of Earth science. The data table shows the location, diameter, and age of some impact craters on Earth. | Crater | Diameter (km) | | --- | --- | | Meteor Crater | 1.2 | | Chicxulub | 180 | | Sierra Madera | 13 | | Red Wing Creek | 9 | | Wells Creek | 14 | | Clearwater Lakes | 22 | | Pilot Lake | 6 | 84 State the name of the crater that has a diameter approximately equal to the straight line distance, in kilometers, between Ithaca, New York and Slide Mountain, New York.
From the Generalized Landscape Regions of New York State map in the Earth Science Reference Tables: | Location | Position on ESRT NY map | | --- | --- | | Ithaca | south-central NY, at the southern end of Cayuga Lake (about 42.4 N, 76.5 W) | | Slide Mountain | in the Catskills of southeastern NY (about 42.0 N, 74.4 W) | Measured with the map scale, the straight line distance between Ithaca and Slide Mountain is approximately 180 km.
Worked solution
Using the ESRT map of New York State, the straight-line distance from Ithaca to Slide Mountain is roughly 175 to 180 km, which matches the 180 km diameter of the Chicxulub crater in the table.
Base your answers to questions 83 through 85 on the data table and map below and on your knowledge of Earth science. 85 Identify one type of solar system object that could have impacted Earth's surface to create any of these craters.
Worked solution
Impact craters like those in the table are created when objects such as asteroids (or meteoroids/comets) strike Earth's surface at high speed.